Fig. 2
Download original image
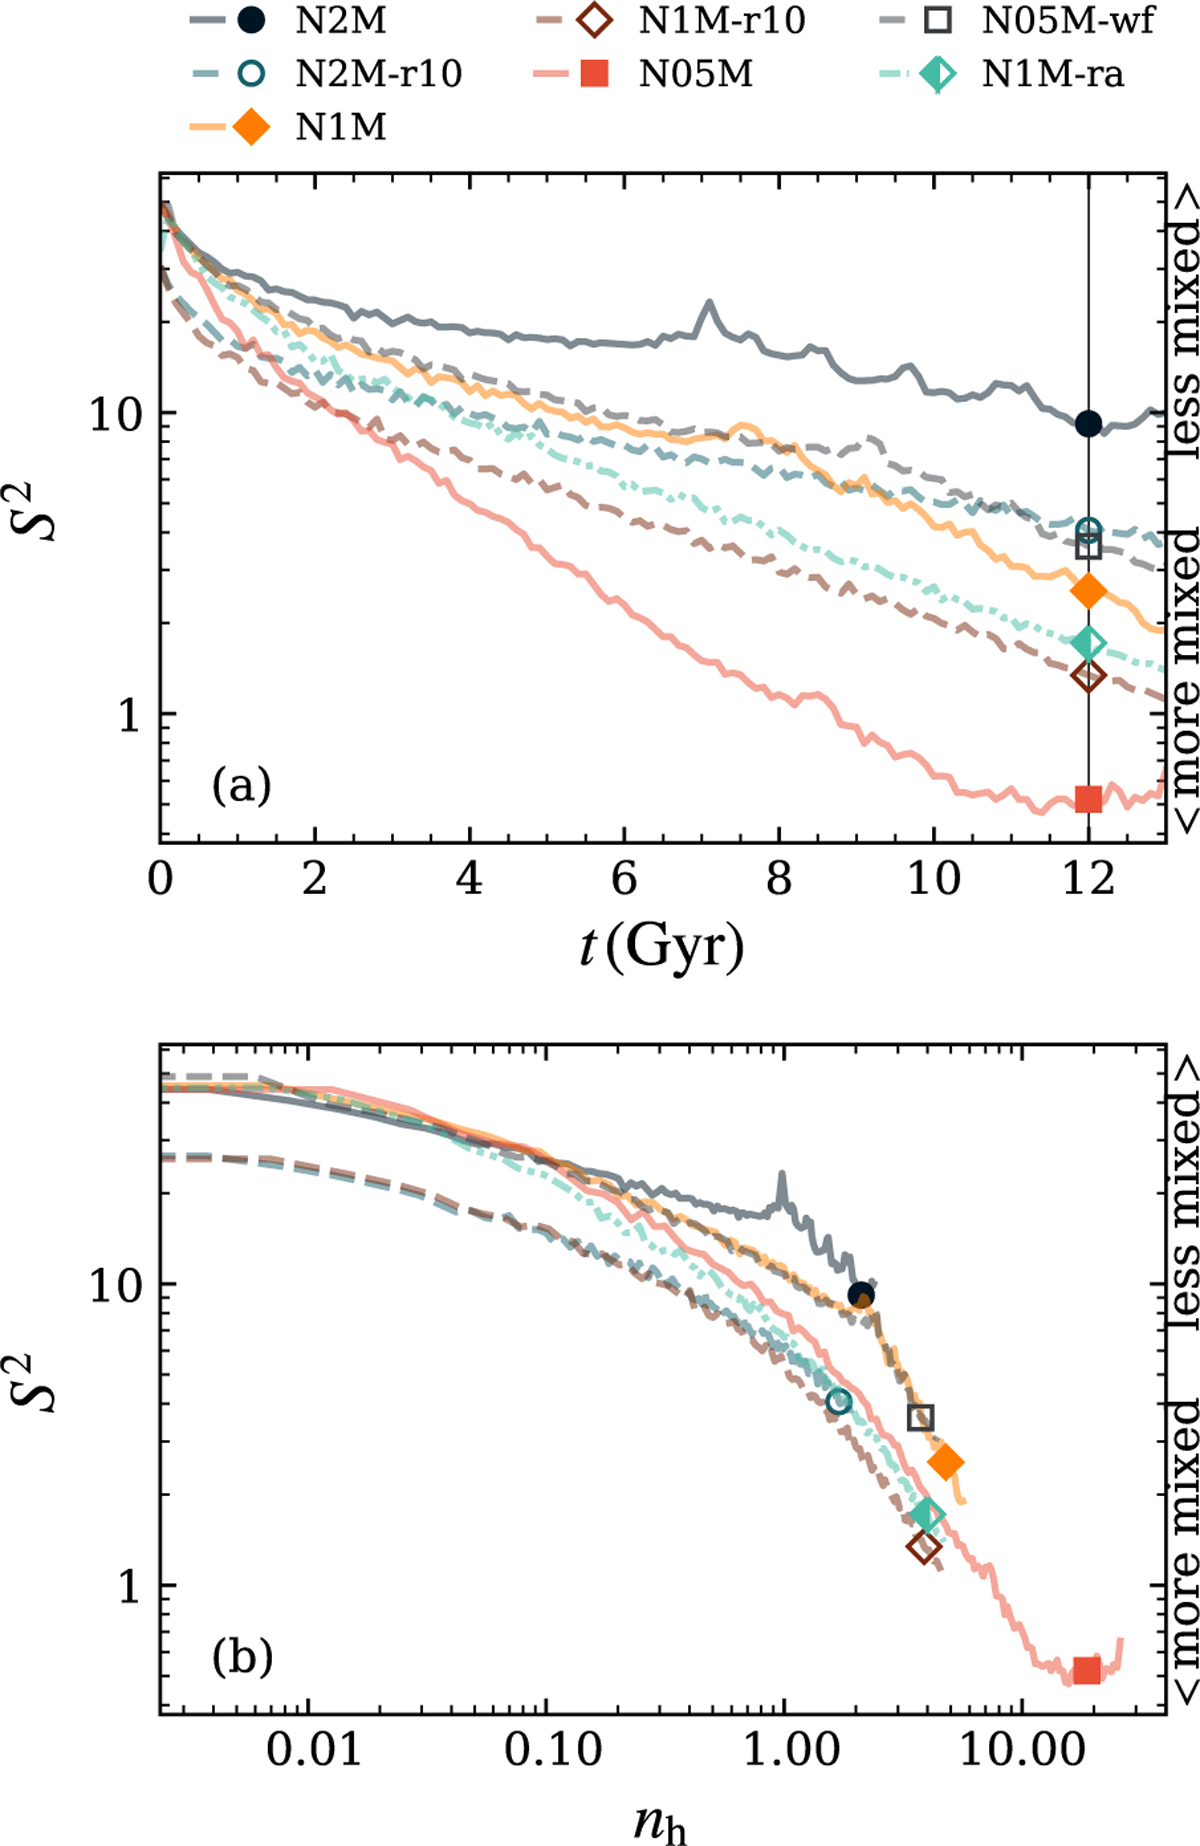
Evolution of the S2 parameter for all models. Panel (a) shows the evolution of S2 with respect to the physical time in the simulations. All models show different degrees of mixing at most times. At t = 12 Gyr (vertical line), model N2M is the least mixed, while model N05M is the most mixed in phase space. Panel (b) shows the evolution of S2 as a function of the number of half-mass relaxation times. The symbols show the value of S2 at 12 Gyr and the respective number of relaxation times.
Current usage metrics show cumulative count of Article Views (full-text article views including HTML views, PDF and ePub downloads, according to the available data) and Abstracts Views on Vision4Press platform.
Data correspond to usage on the plateform after 2015. The current usage metrics is available 48-96 hours after online publication and is updated daily on week days.
Initial download of the metrics may take a while.