Open Access
Fig. B.3
Download original image
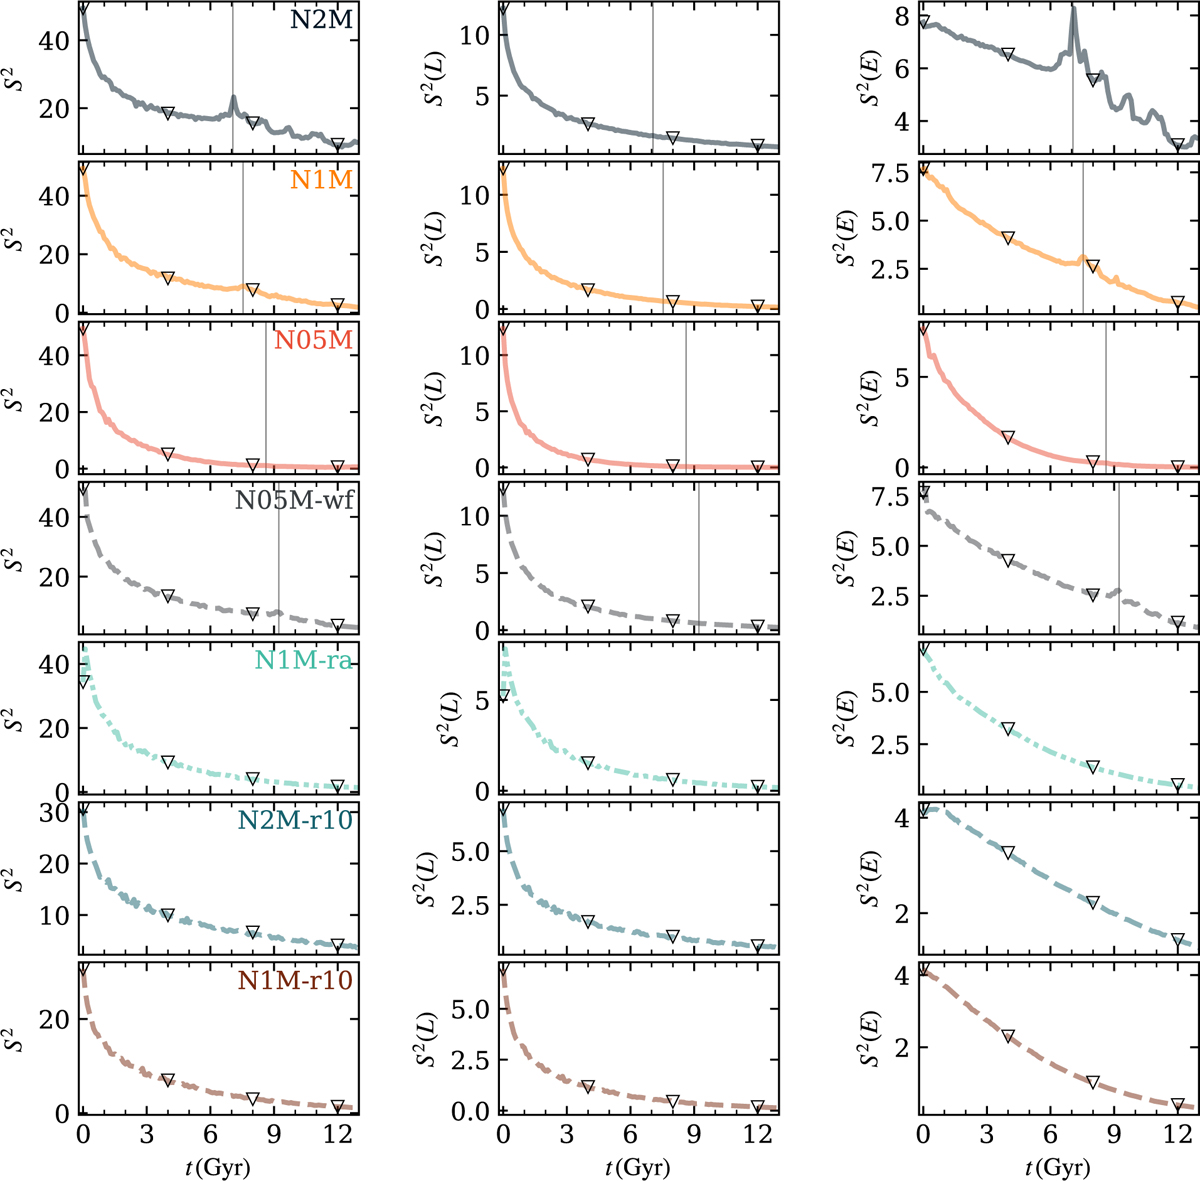
Time evolution of the S2 parameter for all models as in panel (a) in Fig. 2, but separated and also including the marginalisation over angular momentum S2(L) and energy S2(E). We have marked a vertical line at the time of the first core collapse for all models that undergo core collapse within the 13 Gyr of evolution.
Current usage metrics show cumulative count of Article Views (full-text article views including HTML views, PDF and ePub downloads, according to the available data) and Abstracts Views on Vision4Press platform.
Data correspond to usage on the plateform after 2015. The current usage metrics is available 48-96 hours after online publication and is updated daily on week days.
Initial download of the metrics may take a while.