Fig. 10
Download original image
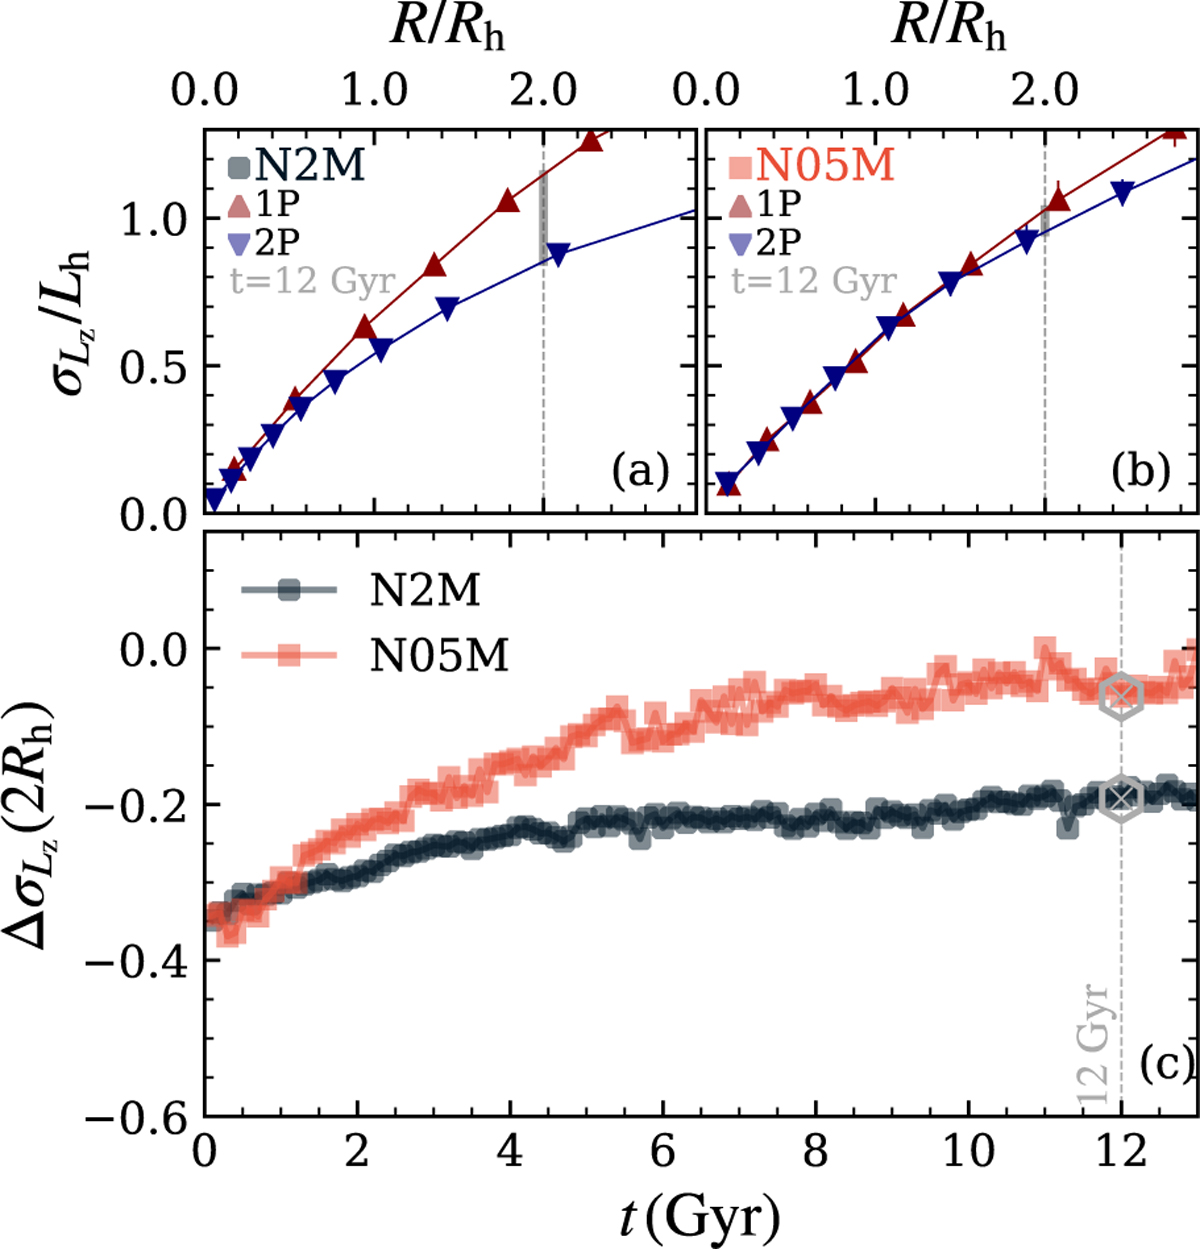
Projected angular momentum dispersion σLz profiles for both populations in the N2M model (panel a) and the N05M model (panel b) at 12 Gyr. The vertical grey solid lines in panels a and b represent the difference in σLz between the populations at R = 2Rh. Panel c shows the time evolution of σLz difference at 2Rh; the closer this value is to zero, the closer the two populations are to kinematically mixing.
Current usage metrics show cumulative count of Article Views (full-text article views including HTML views, PDF and ePub downloads, according to the available data) and Abstracts Views on Vision4Press platform.
Data correspond to usage on the plateform after 2015. The current usage metrics is available 48-96 hours after online publication and is updated daily on week days.
Initial download of the metrics may take a while.