Fig. 1
Download original image
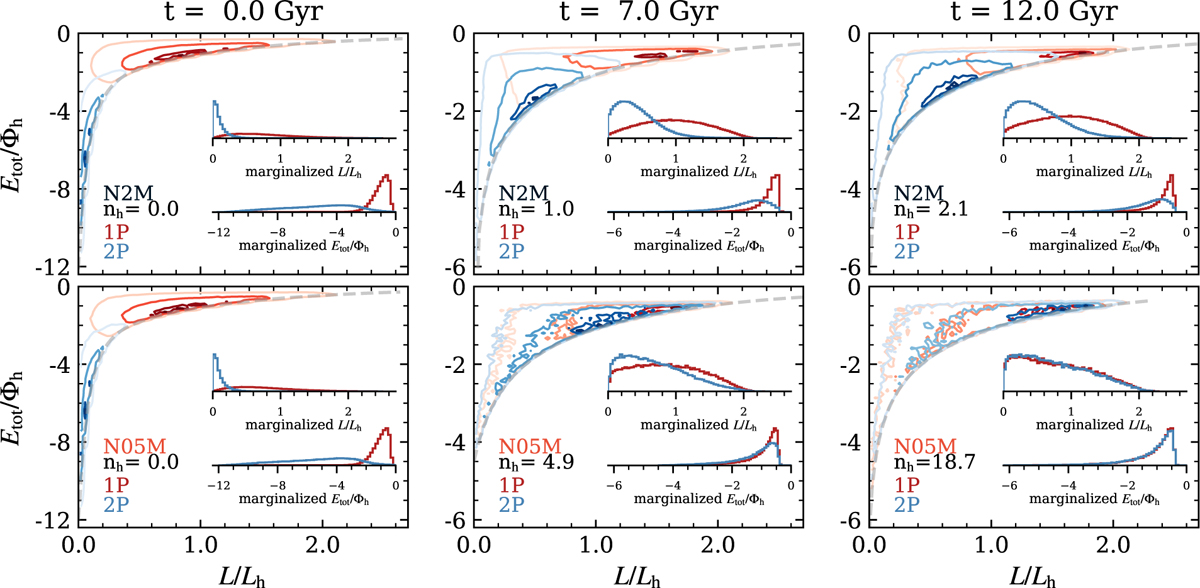
Phase-space distribution of stars in the 1Ps and 2Ps for the models N2M and N05M at different times. At t = 0 Gyr, both clusters show a similar relative distribution of stars in the 1Ps (red) and 2Ps (blue), due to their similar half-mass radius and mass ratios. As the clusters evolve, the 2P expands towards the regions initially dominated by the 1P. By t = 12 Gyr, the N2M model is still partially mixed, while the N05M model has a significant degree of mixing. The insets show the marginalised distribution of energy and angular momentum, likewise highlighting the evolution of dynamical mixing. In all panels, the dashed lines follow the maximum allowed angular momentum at a given energy, defined by the angular momentum of the circular orbit of the corresponding energy.
Current usage metrics show cumulative count of Article Views (full-text article views including HTML views, PDF and ePub downloads, according to the available data) and Abstracts Views on Vision4Press platform.
Data correspond to usage on the plateform after 2015. The current usage metrics is available 48-96 hours after online publication and is updated daily on week days.
Initial download of the metrics may take a while.