Open Access
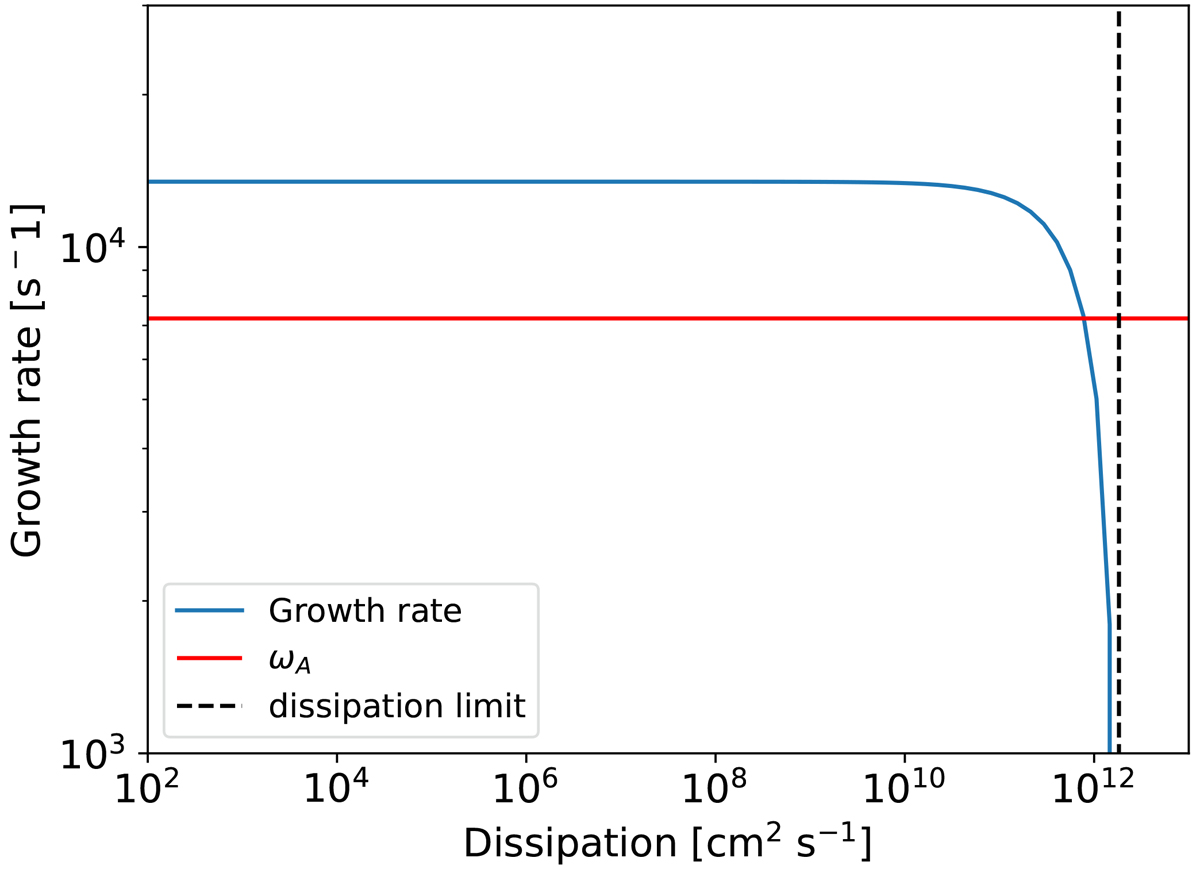
Fig. 8.
Download original image
Growth rate of the Tayler instability as a function of dissipation, with ν = η = κ. The red line shows the theoretical growth rate in the regime of Ω ≪ ωA. The dashed line is the stabilizing limit given by kTI2η = ωA.
Current usage metrics show cumulative count of Article Views (full-text article views including HTML views, PDF and ePub downloads, according to the available data) and Abstracts Views on Vision4Press platform.
Data correspond to usage on the plateform after 2015. The current usage metrics is available 48-96 hours after online publication and is updated daily on week days.
Initial download of the metrics may take a while.