Open Access
Fig. 9.
Download original image
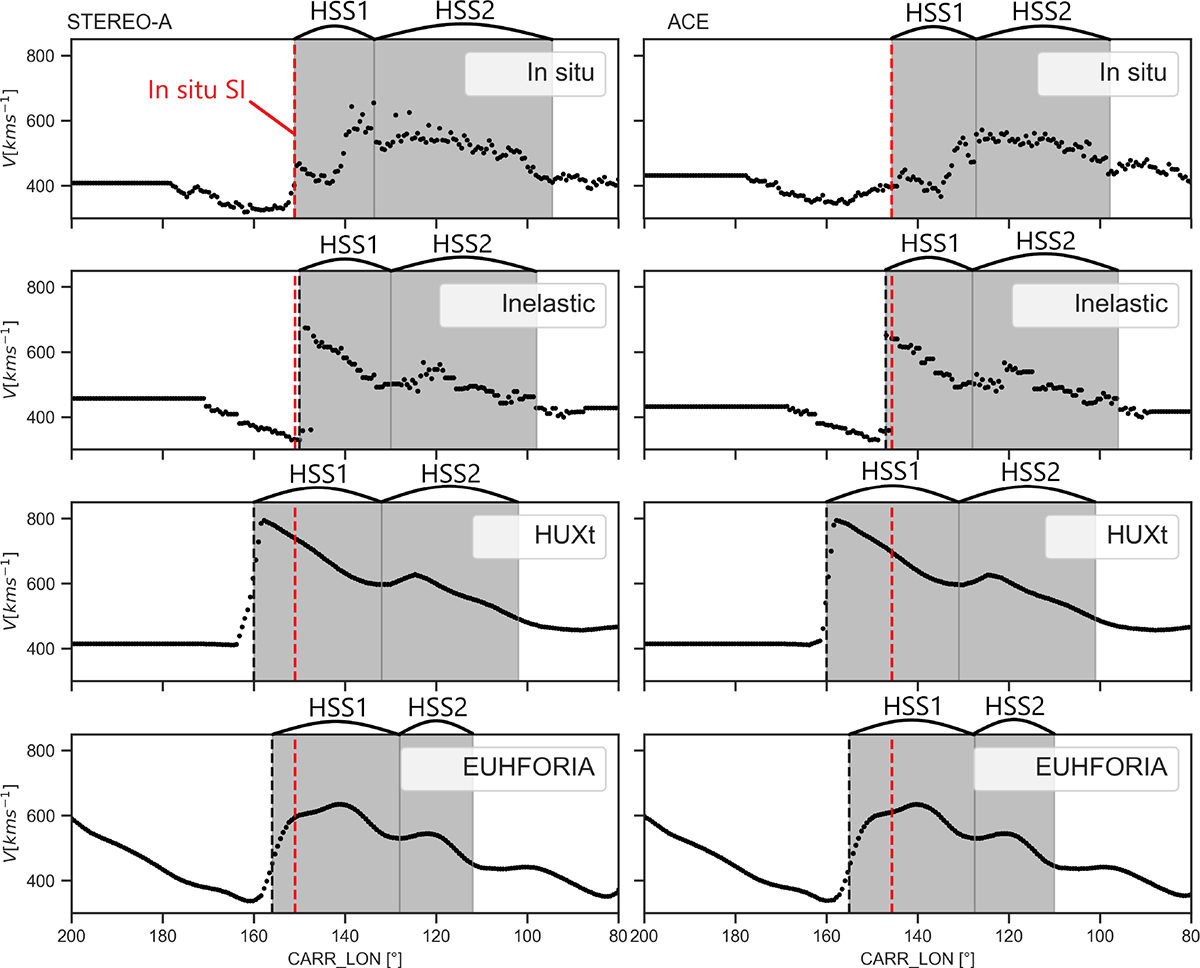
in situ velocity profile (top panel) and each model velocity profile for STEREO-A and ACE. The vertical lines indicate the position of the SI; black: the position of the SI for each model; red: the position of the SI in the in situ data for comparison.
Current usage metrics show cumulative count of Article Views (full-text article views including HTML views, PDF and ePub downloads, according to the available data) and Abstracts Views on Vision4Press platform.
Data correspond to usage on the plateform after 2015. The current usage metrics is available 48-96 hours after online publication and is updated daily on week days.
Initial download of the metrics may take a while.