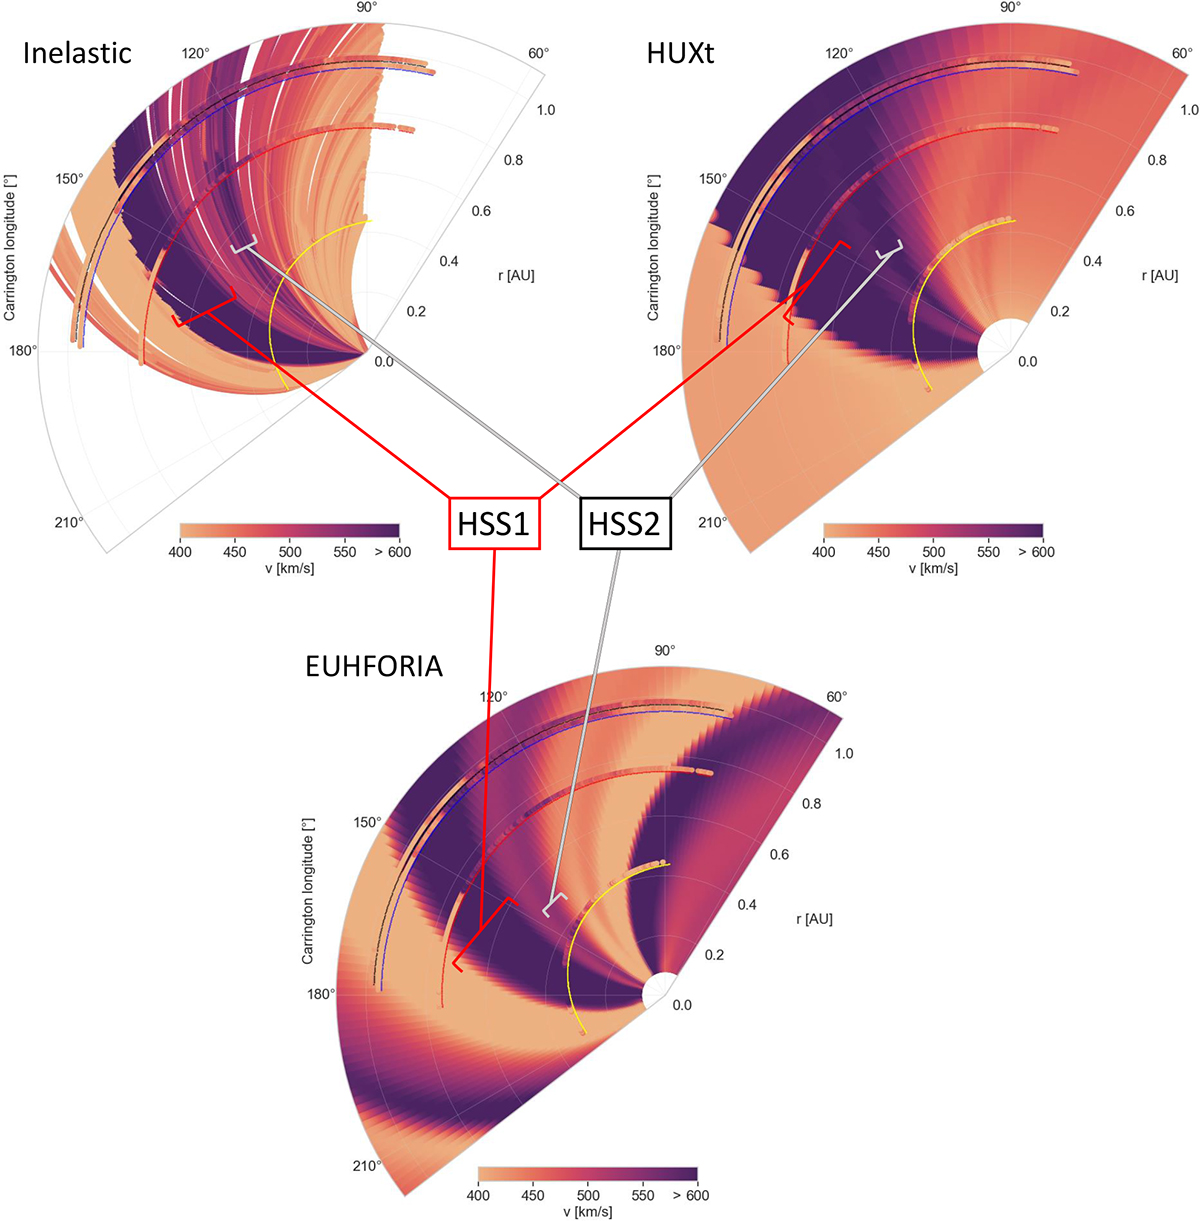
Fig. 7.
Download original image
Each plot shows the velocity profile of the associated model in the background color-coded and on top are the paths of the spacecraft with their respective in situ measured velocities. Next to the paths of the spacecraft, there are colored paths indicating the spacecraft (cf. Figure 2); yellow: SolO, red: PSP, black: STEREO-A and blue: ACE. In the online version of the article we also present a movie showing the inelastic propagation in process.
Current usage metrics show cumulative count of Article Views (full-text article views including HTML views, PDF and ePub downloads, according to the available data) and Abstracts Views on Vision4Press platform.
Data correspond to usage on the plateform after 2015. The current usage metrics is available 48-96 hours after online publication and is updated daily on week days.
Initial download of the metrics may take a while.