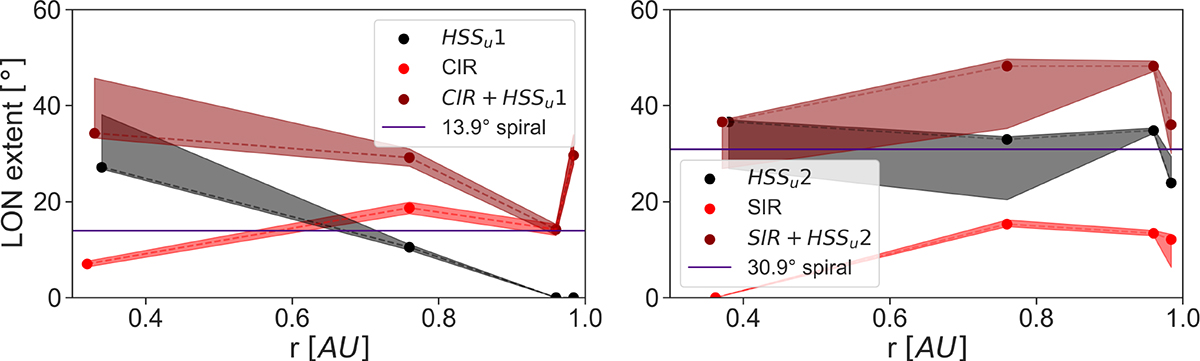
Fig. 5.
Download original image
Evolution of the extent of the structures. The black dots with the gray area represent the longitudinal extent of the unperturbed CH plasma (HSSu) and the red dots with the light red area are the longitudinal extent of the CIR/SIR (perturbed solar wind + HSSp). The dark red lines represent the longitudinal extent of the entire CIR/SIR + HSSu. The areas are the respective uncertainties. The purple line shows the extent of an area, that is bound by two Archimedean spirals, which are separated by 13.9° (CH1) and 30.9° (CH2).
Current usage metrics show cumulative count of Article Views (full-text article views including HTML views, PDF and ePub downloads, according to the available data) and Abstracts Views on Vision4Press platform.
Data correspond to usage on the plateform after 2015. The current usage metrics is available 48-96 hours after online publication and is updated daily on week days.
Initial download of the metrics may take a while.