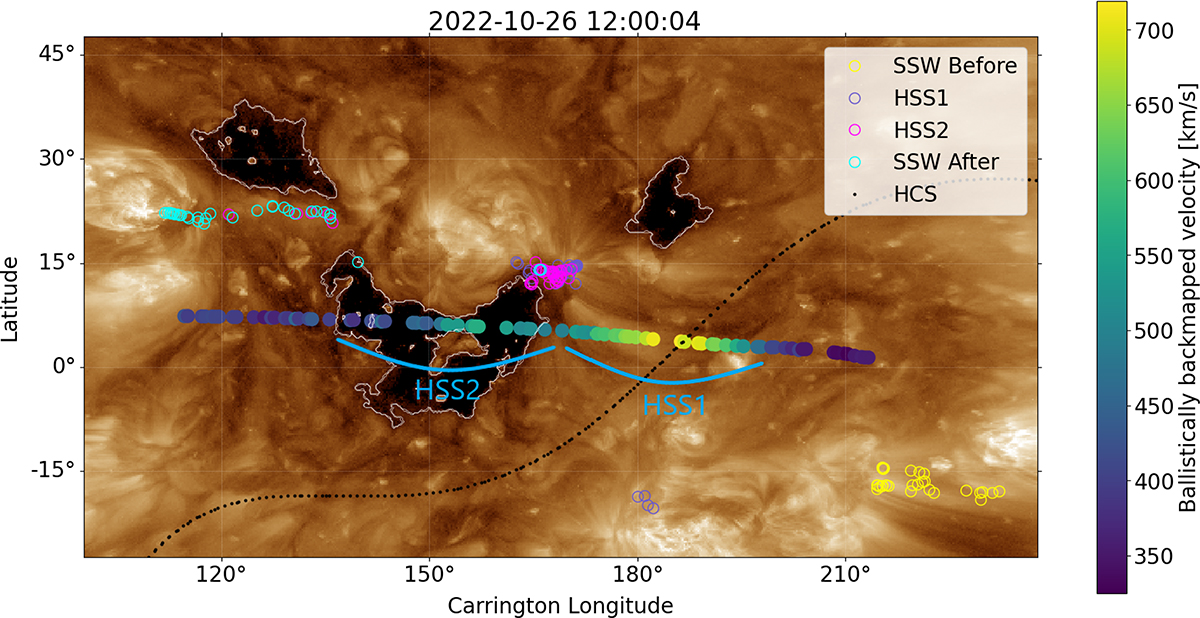
Fig. A.5.
Download original image
Backmapping of in situ data to their source surface. The empty circles show magnetic footpoints from PFSS extrapolation, color-coded with the identified solar wind region found in situ. The colored discs show the ballistic backmapping of Solar Orbiter in situ data during its encounter with the SIRs and HSSs, color-coded with the measured solar wind velocity. The velocity enhancements in the ballistically backmapped data correspond with HSS1 and HSS2. The black dotted line shows the position of the HCS, according to the PFSS solution.
Current usage metrics show cumulative count of Article Views (full-text article views including HTML views, PDF and ePub downloads, according to the available data) and Abstracts Views on Vision4Press platform.
Data correspond to usage on the plateform after 2015. The current usage metrics is available 48-96 hours after online publication and is updated daily on week days.
Initial download of the metrics may take a while.