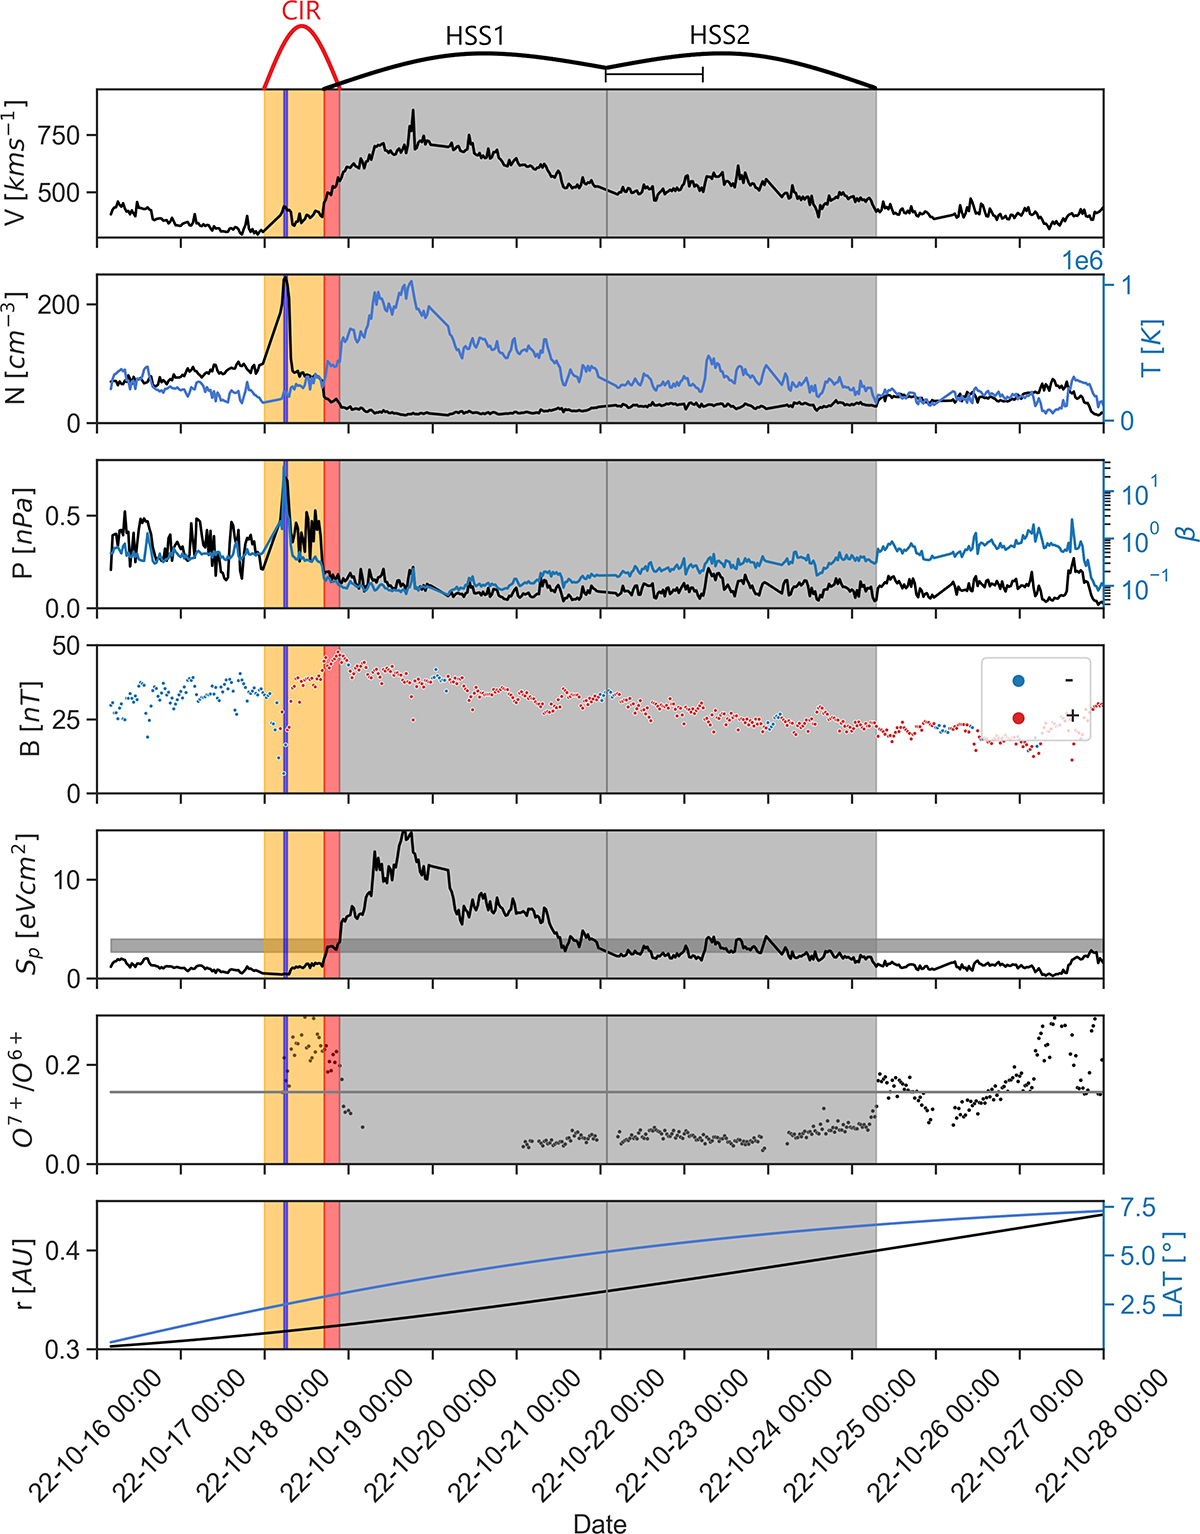
Fig. A.1.
Download original image
Solar Orbiter in situ signature. The blue line represents the HCS, the yellow area is the perturbed slow wind and the gray area is the unperturbed fast wind. From top to bottom: V:proton velocity, N:proton density; T:proton temperature; P:total pressure; β: plasma beta; B:total magnetic field strength; Sp:specific proton entropy; O7+/O6+: O7+/O6+ ratio; r: distance of the spacecraft to the Sun; LAT: latitude of the spacecraft in HCI. Error bars on top of the plot show the uncertainties in the region classification.
Current usage metrics show cumulative count of Article Views (full-text article views including HTML views, PDF and ePub downloads, according to the available data) and Abstracts Views on Vision4Press platform.
Data correspond to usage on the plateform after 2015. The current usage metrics is available 48-96 hours after online publication and is updated daily on week days.
Initial download of the metrics may take a while.