Open Access
Fig. 1.
Download original image
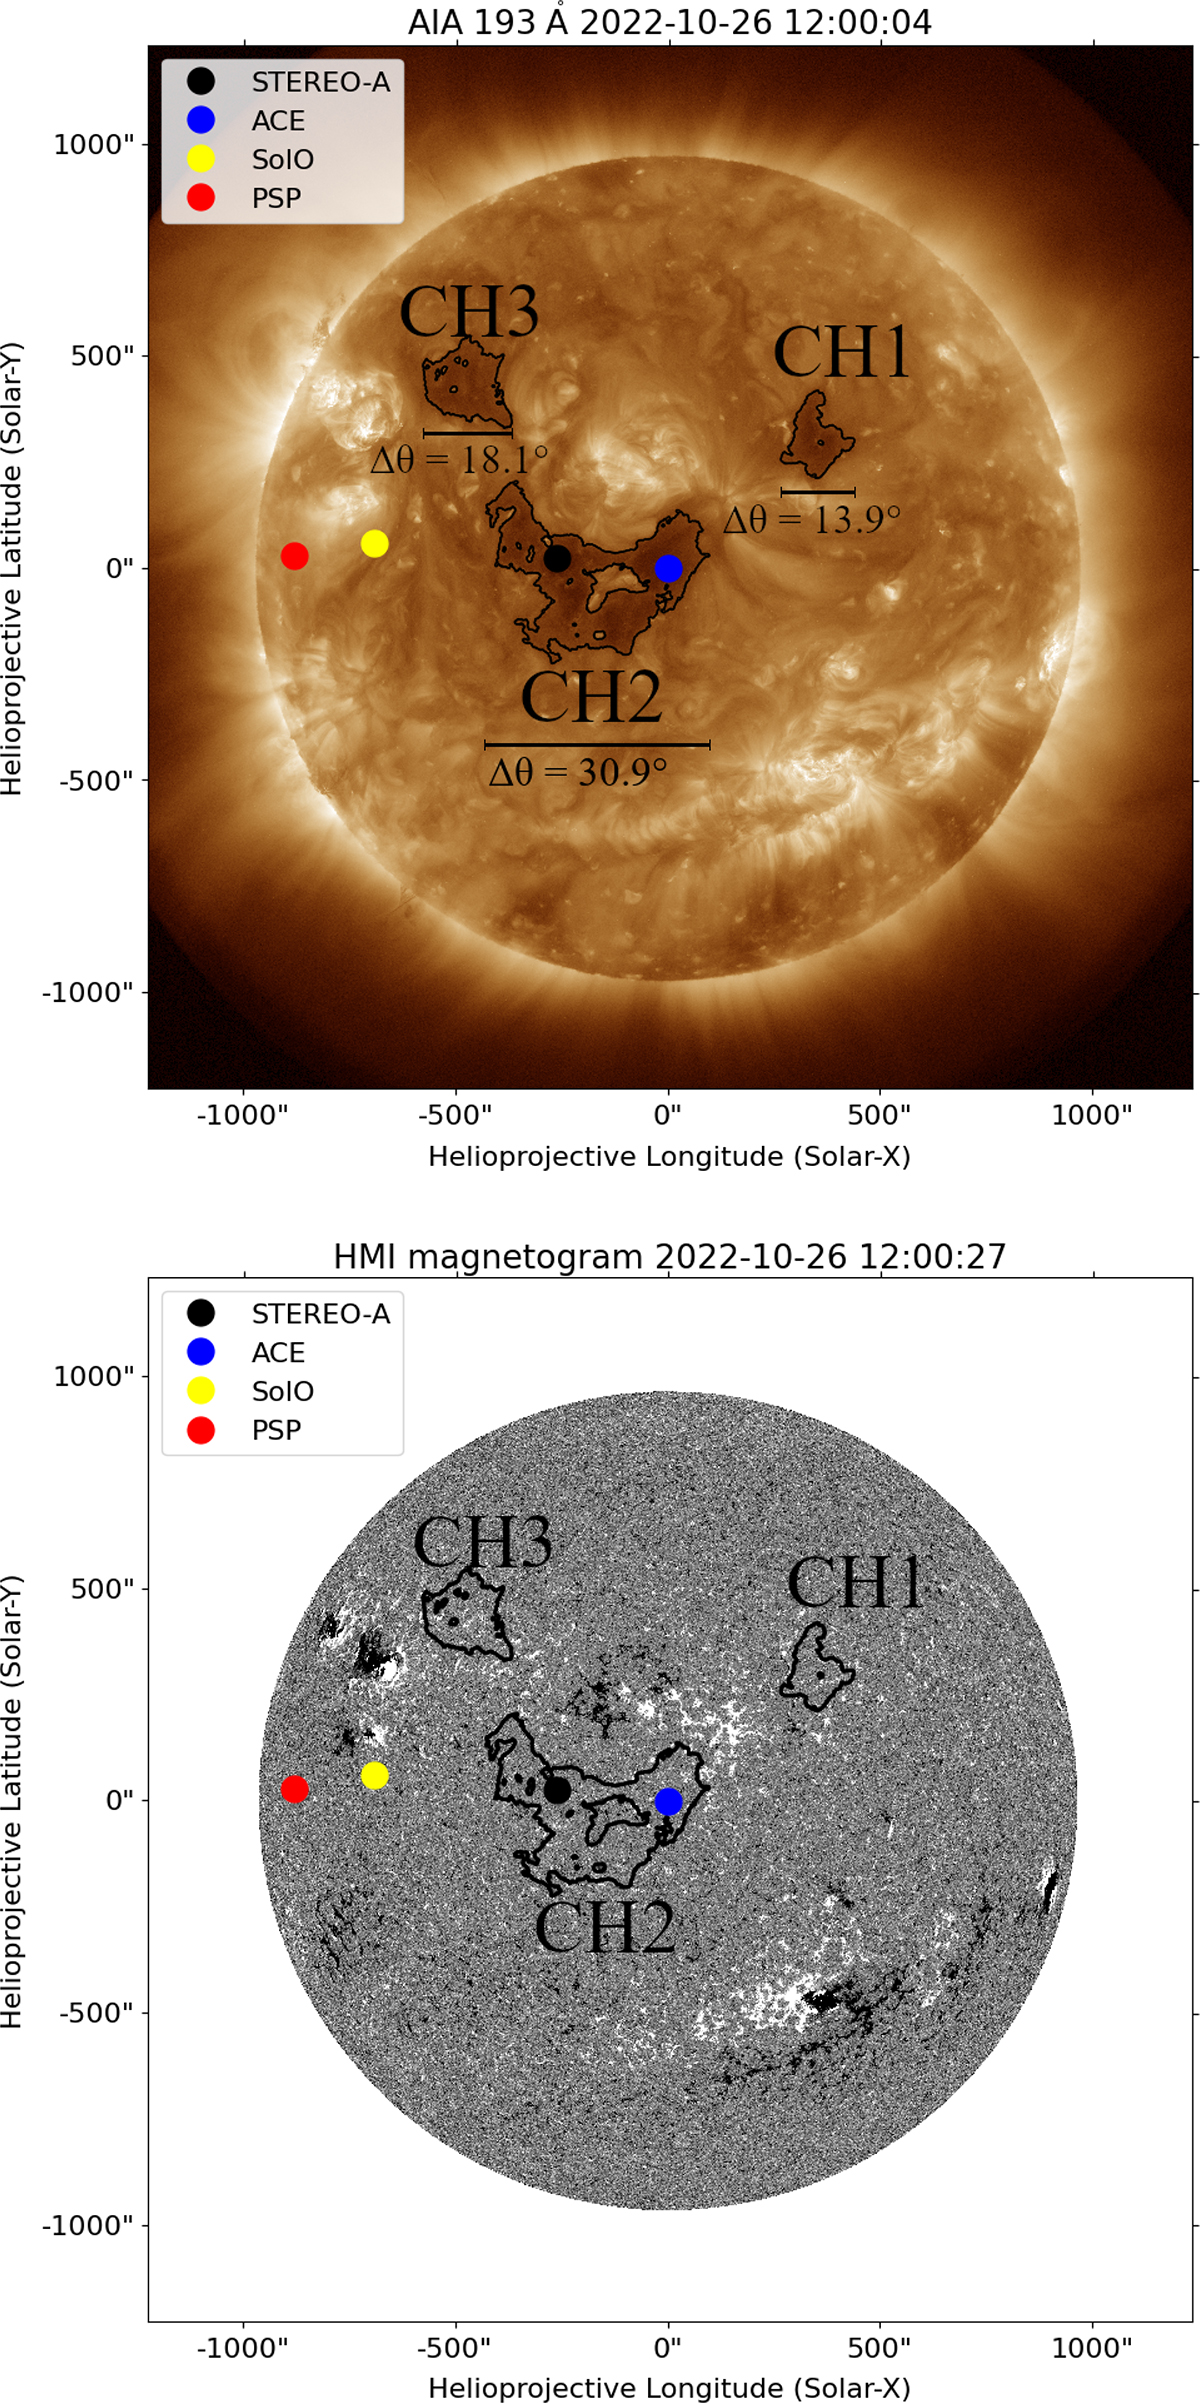
Top: SDO AIA 193 Å image of the solar corona with the projected spacecraft positions. Bottom: SDO HMI magnetogram of the photosphere with the projected spacecraft positions (see legend). Black contours indicate CH boundaries.
Current usage metrics show cumulative count of Article Views (full-text article views including HTML views, PDF and ePub downloads, according to the available data) and Abstracts Views on Vision4Press platform.
Data correspond to usage on the plateform after 2015. The current usage metrics is available 48-96 hours after online publication and is updated daily on week days.
Initial download of the metrics may take a while.