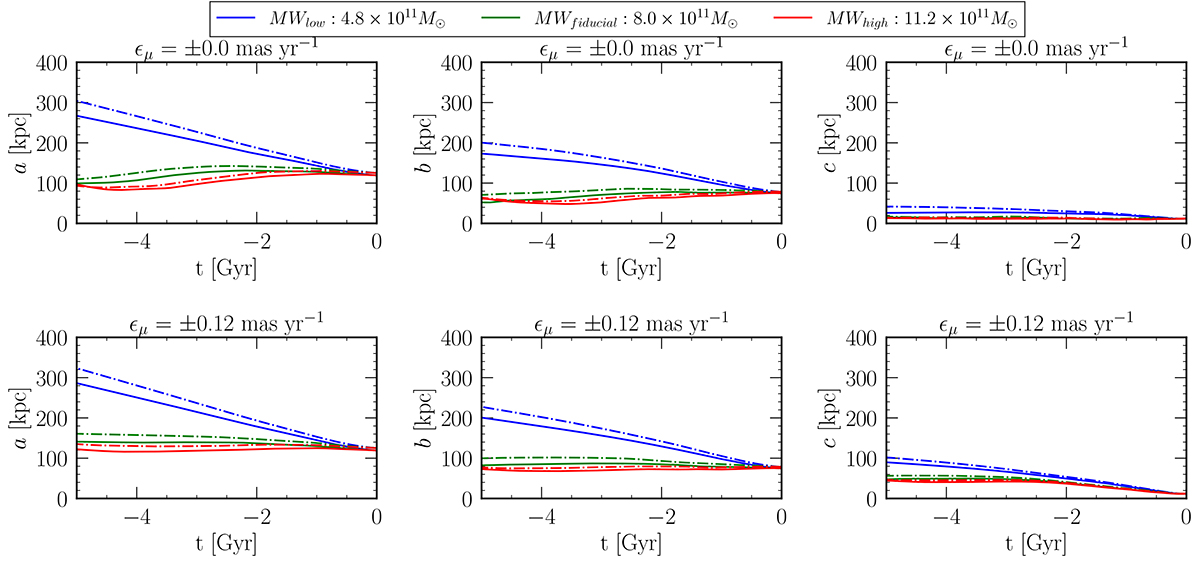
Fig. 8.
Download original image
Comparative analysis of galactic orbital axes under proper motion uncertainties and different potential models at θtan = 80°. Panels shows the mean values of 600 major, minor, and intermediate axes calculated through backward integration. Each panel corresponds to a unique combination of proper motion uncertainty and potential models. Dash-dotted curves show the effect of distance uncertainties, while solid curves show results without distance uncertainties. Rows correspond to different levels of proper motion uncertainty, while columns represent the three axes: major (left), intermediate (center), and minor (right).
Current usage metrics show cumulative count of Article Views (full-text article views including HTML views, PDF and ePub downloads, according to the available data) and Abstracts Views on Vision4Press platform.
Data correspond to usage on the plateform after 2015. The current usage metrics is available 48-96 hours after online publication and is updated daily on week days.
Initial download of the metrics may take a while.