Fig. 2.
Download original image
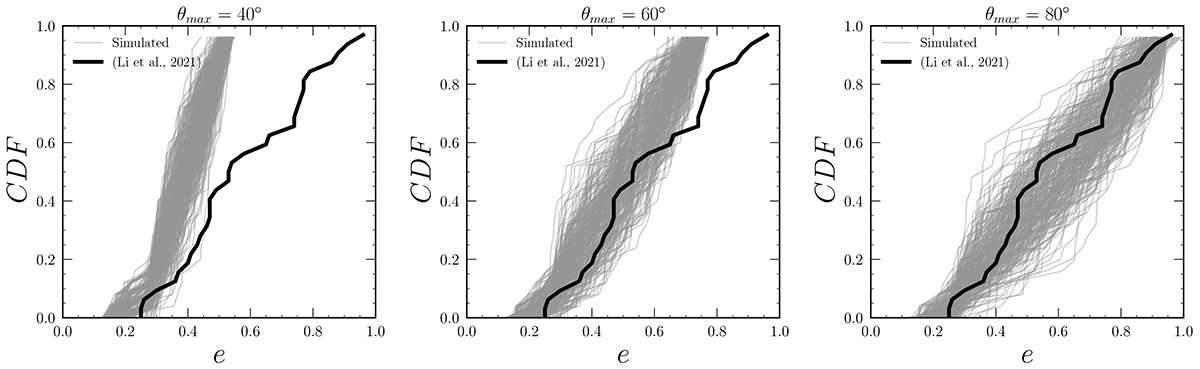
Comparison of eccentricity (e) distributions across different θ. The figure presents the eccentricity CDF for three different θmax: 40°, 60°, and 80°, from left to right, respectively, shown in gray. The solid black line in each panel represents the observed data for Milky Way satellites from (Li et al. 2021), while the overlaid gray CDFs correspond to simulated results for Nsat test satellites.
Current usage metrics show cumulative count of Article Views (full-text article views including HTML views, PDF and ePub downloads, according to the available data) and Abstracts Views on Vision4Press platform.
Data correspond to usage on the plateform after 2015. The current usage metrics is available 48-96 hours after online publication and is updated daily on week days.
Initial download of the metrics may take a while.