Fig. 9
Download original image
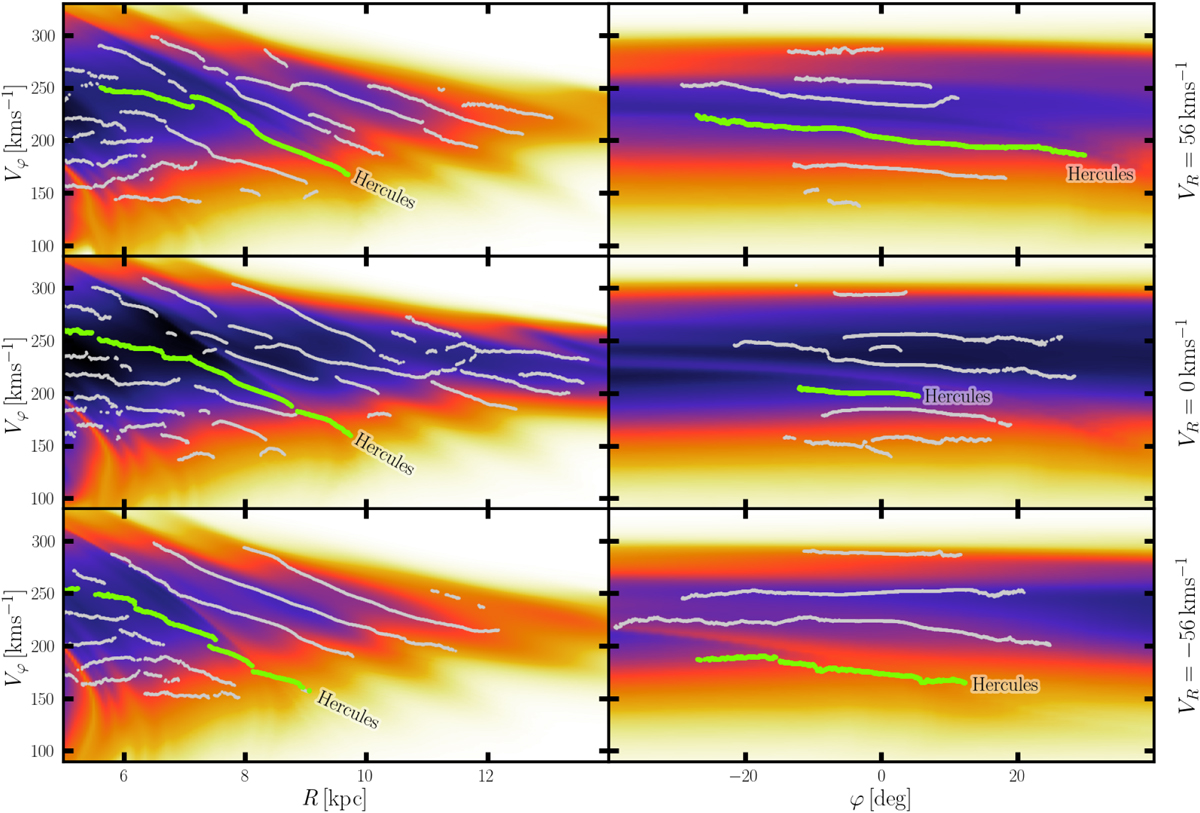
2D histogram distribution of the normalized fiducial model at fixed azimuth φ = 0° (left column), at fixed radius R = R0 (right column) and at fixed VR for each row (VR = 56 km s−1, VR = 0 km s−1 and VR = −56 km s−1). The white (and green) lines display the main ridges identified in Gaia DR3 data with the wavelet transform method developed in Bernet et al. (2022, 2024). A thicker green line denotes the Hercules ridge.
Current usage metrics show cumulative count of Article Views (full-text article views including HTML views, PDF and ePub downloads, according to the available data) and Abstracts Views on Vision4Press platform.
Data correspond to usage on the plateform after 2015. The current usage metrics is available 48-96 hours after online publication and is updated daily on week days.
Initial download of the metrics may take a while.