Fig. 4
Download original image
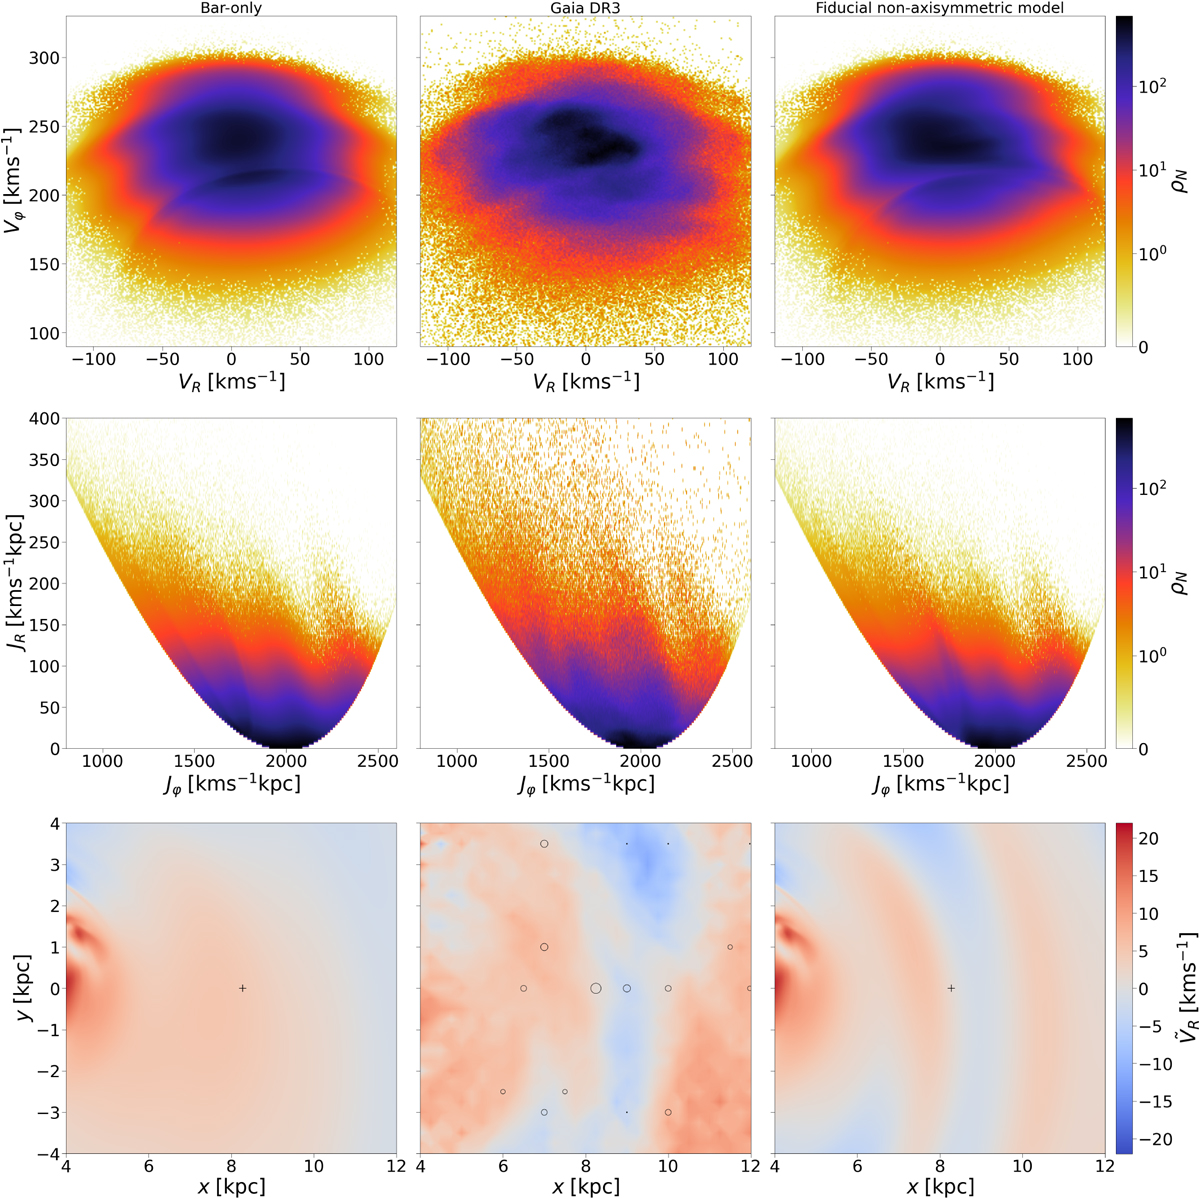
From left to right, the columns correspond to the bar-only model, the Gaia RVS disk sample, and our fiducial non-axisymmetric model, respectively. Top row: 2D histogram of stars in the local (VR, Vφ) plane defined on [−200,200] kms−1 × [0,400] kms−1, binned with bins of size (1 kms−1)2. Middle row: 2D histogram of the number density of stars in the (JR, Jφ) plane defined on [0,400] kms−1 kpc−1 × [800,2600] km s−1 kpc−1, binned with bins of size (3 × 2 km2 s−2 kpc−2). For this, the velocities (VR, Vφ) have been transformed to actions (JR, Jφ) with AGAMA. Bottom row: Median ![]() shown in the (x, y) plane defined on [4,12] kpc × [−4,4] kpc, and binned with bins of size (250 pc)2 for the data and (50 pc)2 for the models. The cross locates the Sun and circles (with sizes proportional to the weights, the lowest weights being dots) in the middle panel (data) indicate the selected points where the fit has been performed. All panels were smoothed with a bilinear interpolation.
shown in the (x, y) plane defined on [4,12] kpc × [−4,4] kpc, and binned with bins of size (250 pc)2 for the data and (50 pc)2 for the models. The cross locates the Sun and circles (with sizes proportional to the weights, the lowest weights being dots) in the middle panel (data) indicate the selected points where the fit has been performed. All panels were smoothed with a bilinear interpolation.
Current usage metrics show cumulative count of Article Views (full-text article views including HTML views, PDF and ePub downloads, according to the available data) and Abstracts Views on Vision4Press platform.
Data correspond to usage on the plateform after 2015. The current usage metrics is available 48-96 hours after online publication and is updated daily on week days.
Initial download of the metrics may take a while.