Fig. 10
Download original image
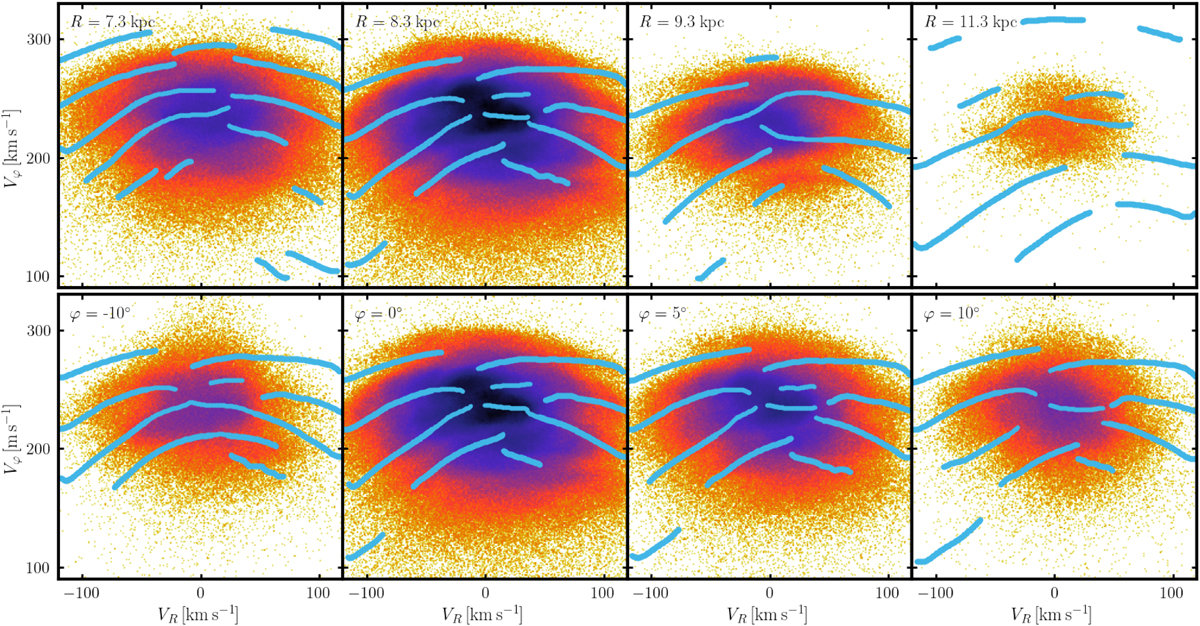
2D histogram distribution of the Gaia RVS disk sample in the (VR, Vφ) plane for stars within |φ| < 2.4° and |R - Ri| < 300 pc at different radii Ri ∈ [7.3, 8.3, 9.3, 11.3] kpc (top row), and for stars within an annulus |R - R0| < 300 pc and ![]() at different azimuthal angles φj ∈ [−10°, 0°, 5°, 10°] (bottom row). The colored lines show the peaks identified in our model with the method of Bernet et al. (2022, 2024).
at different azimuthal angles φj ∈ [−10°, 0°, 5°, 10°] (bottom row). The colored lines show the peaks identified in our model with the method of Bernet et al. (2022, 2024).
Current usage metrics show cumulative count of Article Views (full-text article views including HTML views, PDF and ePub downloads, according to the available data) and Abstracts Views on Vision4Press platform.
Data correspond to usage on the plateform after 2015. The current usage metrics is available 48-96 hours after online publication and is updated daily on week days.
Initial download of the metrics may take a while.