Fig. 1
Download original image
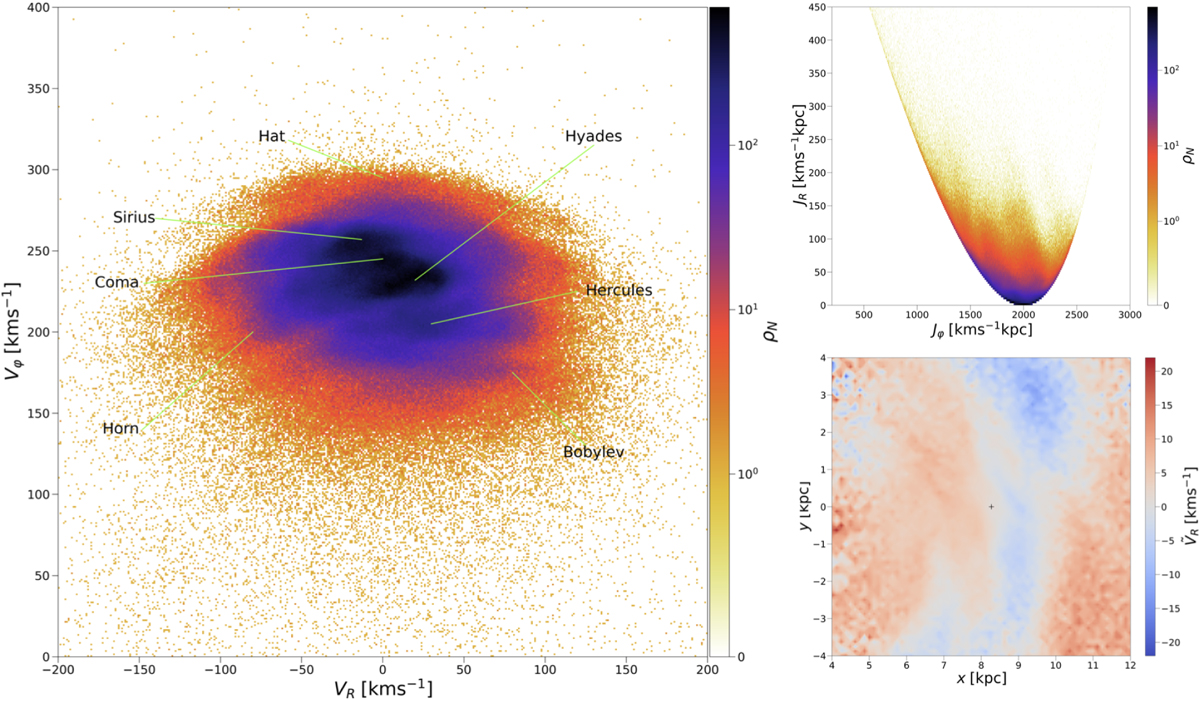
Left panel: 2D histogram of the number density of stars from the Gaia RVS disk sample (in a cylinder of 300 pc radius and ±300 pc height around the Sun) in the (VR, Vφ) plane defined on a [−200,200] kms−1 × [0,400] kms−1 grid, binned with (1 kms−1)2 bins, together with the locations of the different moving groups. Top right panel: Same distribution in the (Jφ, JR) plane (computed with AGAMA in the potential of Table 1 ) defined on a [0, 600] km s−1 kpc−1 × [200, 3000] km s−1 kpc−1 grid, binned with (3 × 2 km2 s−2 kpc−2) bins. Bottom right panel: Median radial velocity VR (x, y) as a function of the position in the Galactic plane for the full sample of 17 414 667 stars with |z| < 300 pc. The grid is defined as [4, 12] kpc × [−4, 4] kpc, binned with (125 pc)2 bins. The Galactic center is located at (x, y) = (0 kpc, 0 kpc), the Sun at (x, y) = (8.275 kpc, 0 kpc) is represented with a cross, and the sense of rotation of the Galaxy is anti-clockwise.
Current usage metrics show cumulative count of Article Views (full-text article views including HTML views, PDF and ePub downloads, according to the available data) and Abstracts Views on Vision4Press platform.
Data correspond to usage on the plateform after 2015. The current usage metrics is available 48-96 hours after online publication and is updated daily on week days.
Initial download of the metrics may take a while.