Fig. 6
Download original image
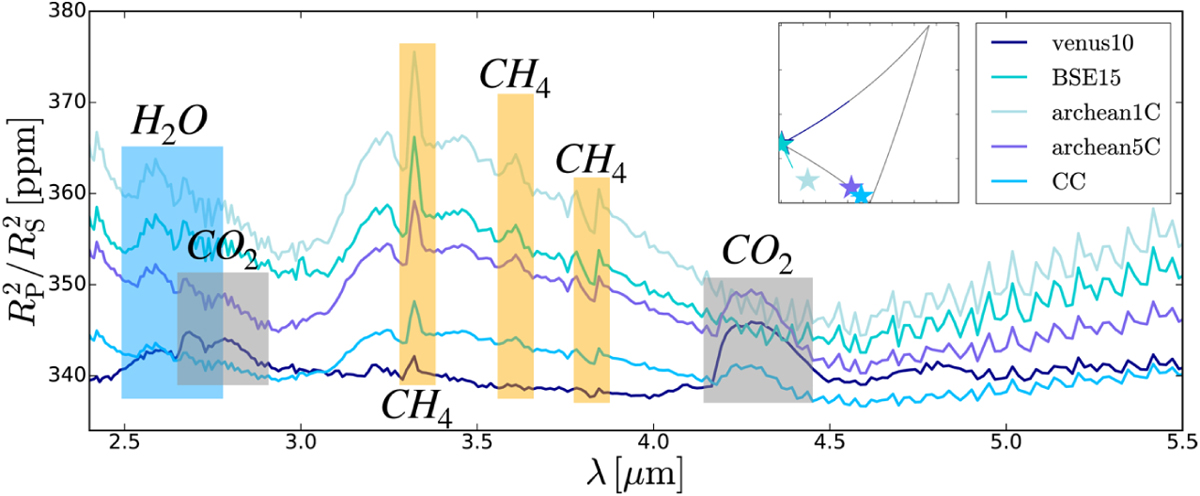
Comparison between spectra from type A and C atmospheres. All spectra have a sharp CH4 feature at 3.3 μm. Spectra originating from atmospheres of type C show a defined CO2 feature at around 4.3 μm, which can be used to differentiate between the two types. However, in the CC (type A) model, a soft CO2 feature emerges at 4.3 μm.
Current usage metrics show cumulative count of Article Views (full-text article views including HTML views, PDF and ePub downloads, according to the available data) and Abstracts Views on Vision4Press platform.
Data correspond to usage on the plateform after 2015. The current usage metrics is available 48-96 hours after online publication and is updated daily on week days.
Initial download of the metrics may take a while.