Fig. 1.
Download original image
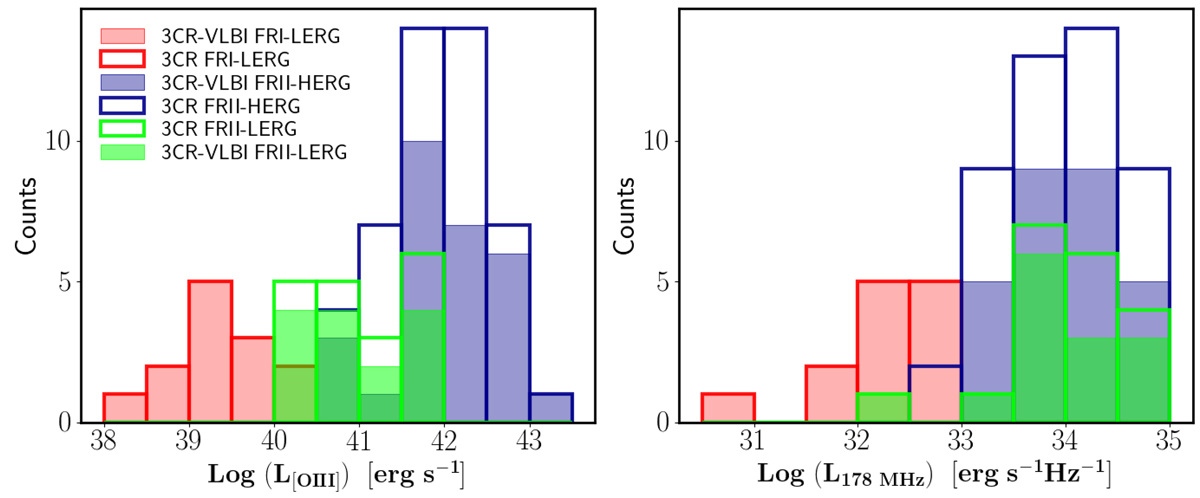
Luminosity distributions of the [O III] λ5007 optical lines (left panel) and at 178 MHz (right panel) for different radio-optical classes from the original 3CR sample studied by Buttiglione et al. (2009, 2010, 2011) and its subset with milliarcsecond observations (3CR-VLBI sample). The filled portion of each histogram bin represents objects with VLBI observations, while the total height of the bin corresponds to the number of sources in the original 3CR sample. The distribution of the VLBI subsample closely follows that of the original sample.
Current usage metrics show cumulative count of Article Views (full-text article views including HTML views, PDF and ePub downloads, according to the available data) and Abstracts Views on Vision4Press platform.
Data correspond to usage on the plateform after 2015. The current usage metrics is available 48-96 hours after online publication and is updated daily on week days.
Initial download of the metrics may take a while.