Open Access
Fig. 7
Download original image
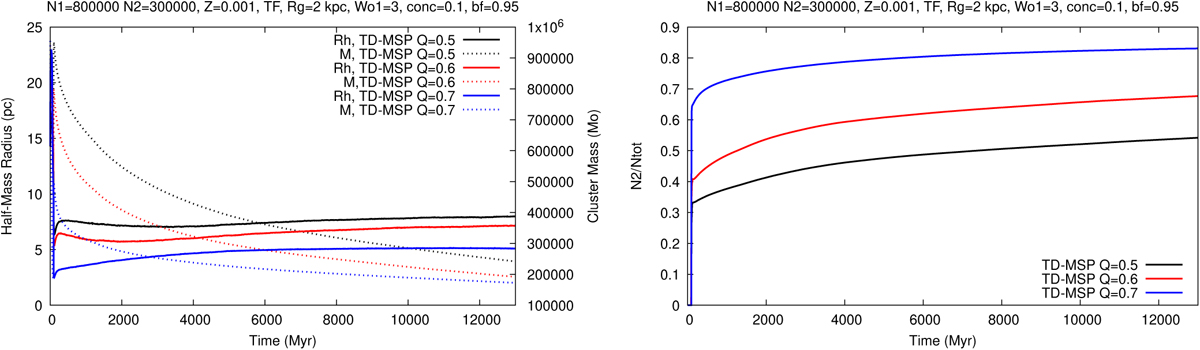
Left panel: evolution of Rh (solid lines) and the cluster total mass (dashed lines) for TD-MSP models with different Q1. Right panel: evolution of the ratio N2/Ntot for TD-MSP models with different Q1. The global cluster parameters are listed at the top of each panel and are the same as for Figure 1.
Current usage metrics show cumulative count of Article Views (full-text article views including HTML views, PDF and ePub downloads, according to the available data) and Abstracts Views on Vision4Press platform.
Data correspond to usage on the plateform after 2015. The current usage metrics is available 48-96 hours after online publication and is updated daily on week days.
Initial download of the metrics may take a while.