Fig. 3
Download original image
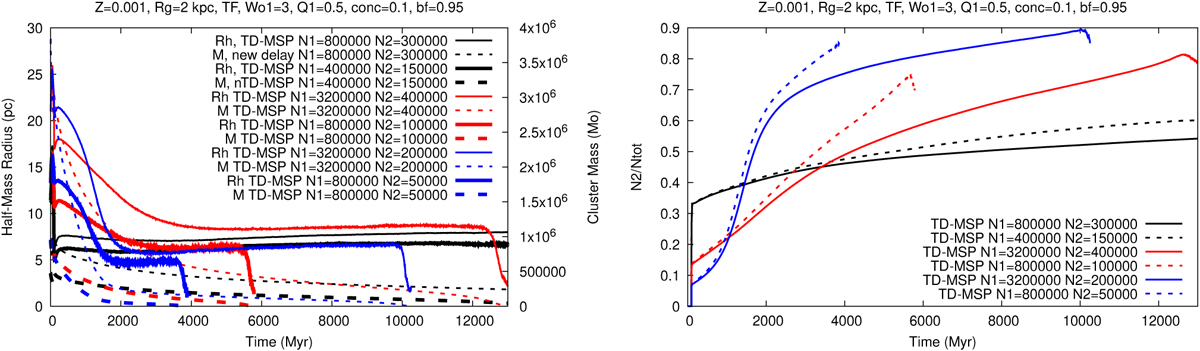
Left panel: evolution of Rh (solid lines) and the cluster total mass (dashed lines) for TD-MSP models with different numbers of 1P objects and 2P objects. Right panel: evolution of the ratio N2/Ntot for TD-MSP models with different numbers of 1P objects and 2P objects. The global cluster parameters are listed at the top of each panel and are the same as for Figure 1. Note the sudden drop in Rh observed in this and the following figures. It is related to the dispersion of the cluster on the dynamical timescale as a result of the presence and energy generation by the BHS (Giersz et al. 2019).
Current usage metrics show cumulative count of Article Views (full-text article views including HTML views, PDF and ePub downloads, according to the available data) and Abstracts Views on Vision4Press platform.
Data correspond to usage on the plateform after 2015. The current usage metrics is available 48-96 hours after online publication and is updated daily on week days.
Initial download of the metrics may take a while.