Fig. 2
Download original image
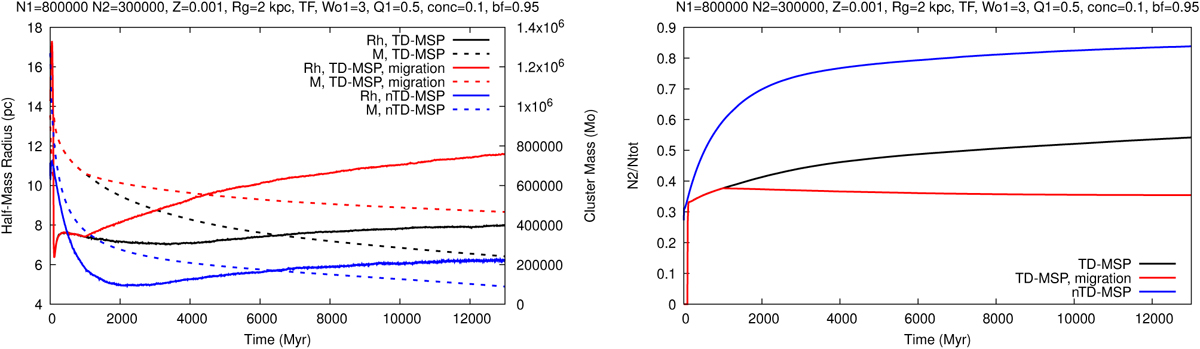
Left panel: evolution of Rh for nTD-MSP model (solid blue line), TD-MSP model (solid black line), and TD-MSP model with migration (solid red line), and evolution of the total cluster mass for nTD-MSP model (dashed blue line), TD-MSP model (dashed black line), and TD-MSP model with migration (dashed red line). Right panel: evolution of the ratio N2/Ntot for nTD-MSP model (solid blue line), TD-MSP model (solid black line), and TD-MSP with migration model (solid red line). The global cluster parameters are listed at the top of each panel and are the same as for Figure 1. Note the small reduction in the value of the N2/Ntot ratio for the model with migration. It is related to the fact that after migration, 1P objects do not escape at the same rate as before, and to the fact that mainly 2P objects are ejected from the cluster as a result of dynamic interactions.
Current usage metrics show cumulative count of Article Views (full-text article views including HTML views, PDF and ePub downloads, according to the available data) and Abstracts Views on Vision4Press platform.
Data correspond to usage on the plateform after 2015. The current usage metrics is available 48-96 hours after online publication and is updated daily on week days.
Initial download of the metrics may take a while.