Fig. 13
Download original image
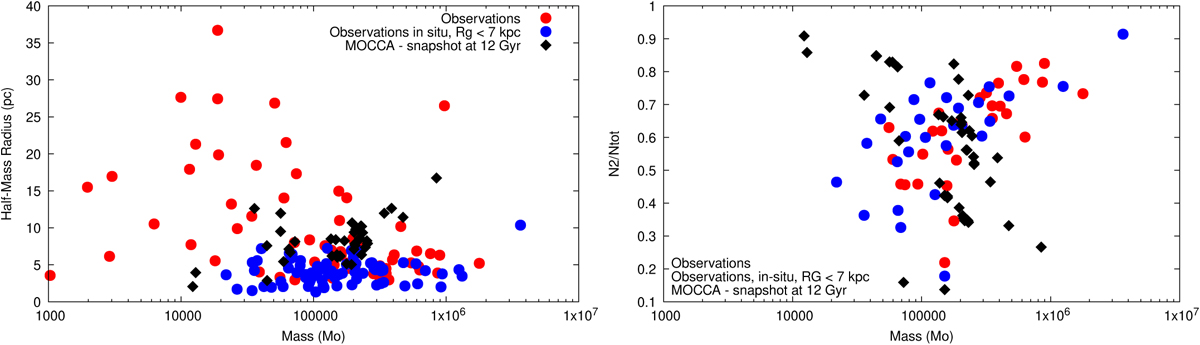
Comparison between observational parameters of MWGCs and simulation results. Red dots represent the observations, blue dots the observations limited to in situ MWGCs and Rg smaller than 7 kpc, and black diamonds the simulations. Left panel: relation between cluster mass and Rh. Right panel: relation between cluster mass and N2/Ntot ratio. Please note that the anticorrelation relationship between cluster mass and N2/Ntot ratio observed in MOCCA models is purely artificial and is related to the choice of initial models. The nTF models and those initially located at large galactocentric distances cannot reproduce the observed parameters of MWGCs.
Current usage metrics show cumulative count of Article Views (full-text article views including HTML views, PDF and ePub downloads, according to the available data) and Abstracts Views on Vision4Press platform.
Data correspond to usage on the plateform after 2015. The current usage metrics is available 48-96 hours after online publication and is updated daily on week days.
Initial download of the metrics may take a while.