Fig. 1
Download original image
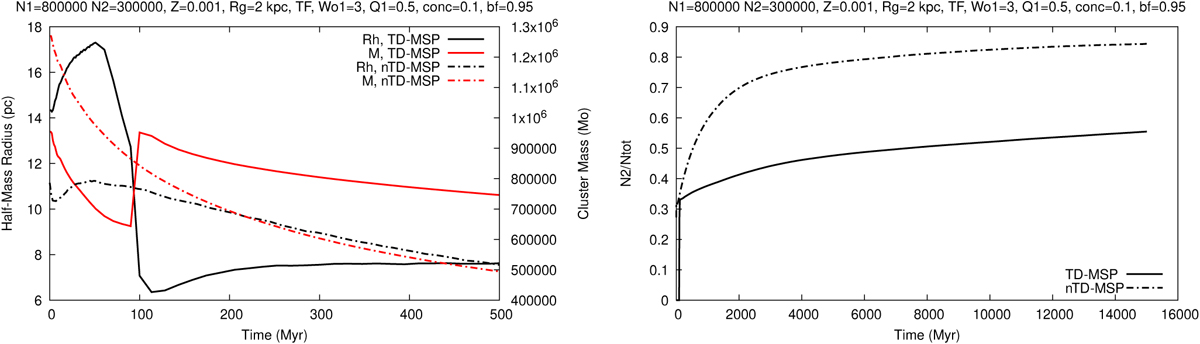
Left panel: evolution of Rh for nTD-MSP model (dash-dotted black line), and TD-MSP model (solid black line), and evolution of the total cluster mass for nTD-MSP model (solid red line), and TD-MSP model (solid red line). Right panel: evolution of the ratio N2/Ntot for the nTD-MSP model (dash-dotted black line), and TD-MSP model (solid black line). The global cluster parameters are listed at the top of each panel: N1− number of 1P objects, N2 – number of 2P objects, Z – metallicity, Rg – galactocentric distance (size of the circular orbit), TF – tidally filling 1P, Wo1− King parameter for 1P, conc – concentration parameter (concpop = Rh 2/Rh1), bf – binary fraction, Q1− virial ratio for 1P. Unless otherwise noted, all figures from now on are made for the parameters tstart = 0.5 * tdelay and tend = tdelay = 100 Myr.
Current usage metrics show cumulative count of Article Views (full-text article views including HTML views, PDF and ePub downloads, according to the available data) and Abstracts Views on Vision4Press platform.
Data correspond to usage on the plateform after 2015. The current usage metrics is available 48-96 hours after online publication and is updated daily on week days.
Initial download of the metrics may take a while.