Fig. 6.
Download original image
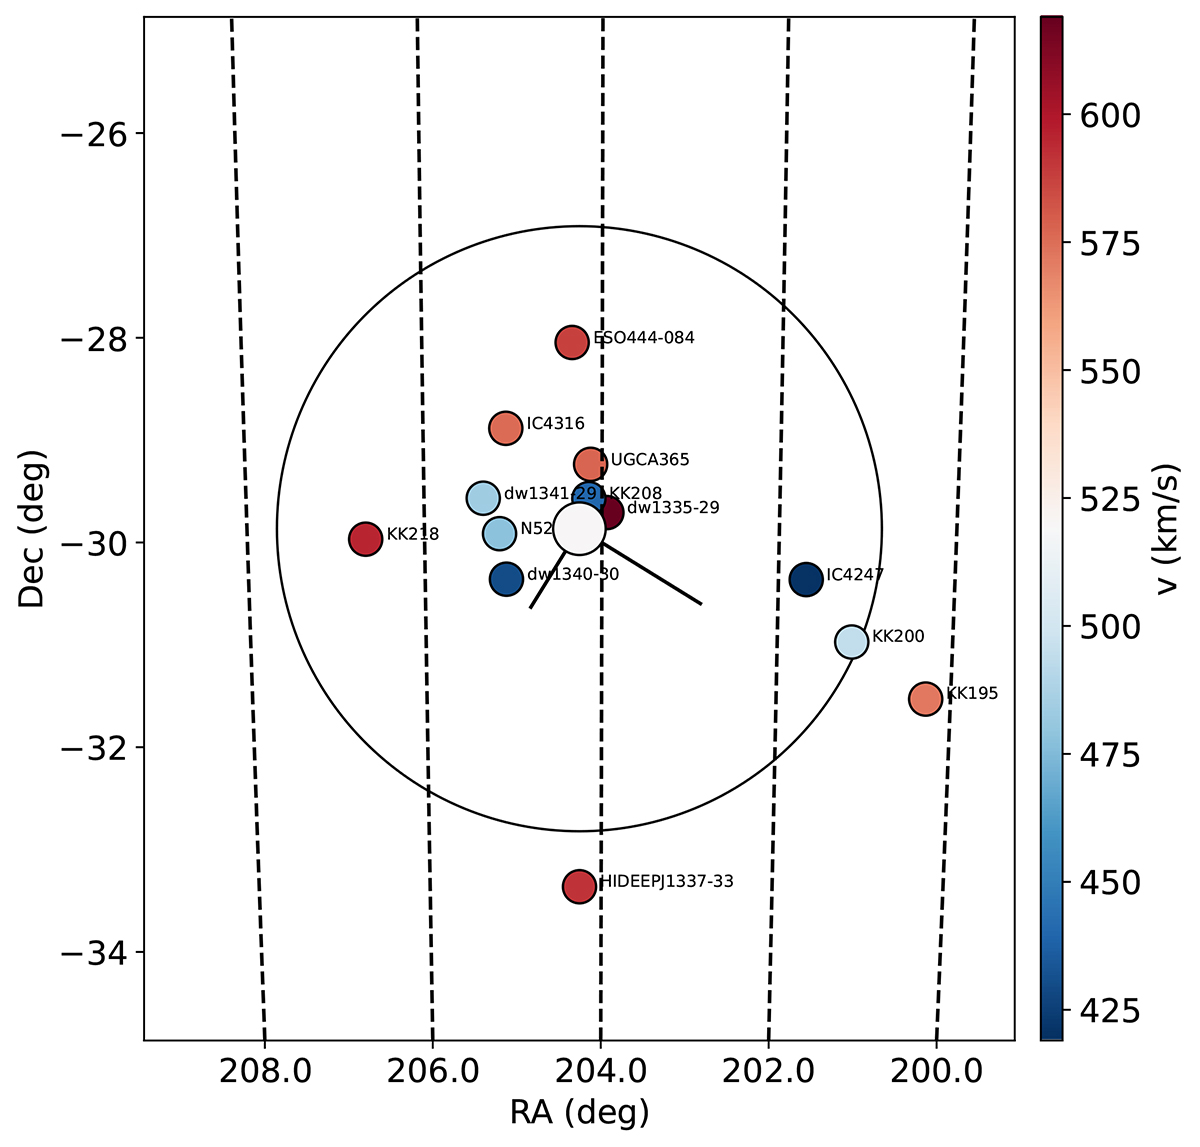
Field around M 83 (large white dot) and its surrounding dwarfs (colored dots) in equatorial coordinates (J2000.0). The colors represent the line-of-sight velocity of the galaxies, as is indicated with the color bar. The two black lines correspond to the minor and major axes of the satellite system (see text), and the circle to the virial radius.
Current usage metrics show cumulative count of Article Views (full-text article views including HTML views, PDF and ePub downloads, according to the available data) and Abstracts Views on Vision4Press platform.
Data correspond to usage on the plateform after 2015. The current usage metrics is available 48-96 hours after online publication and is updated daily on week days.
Initial download of the metrics may take a while.