Fig. 2.
Download original image
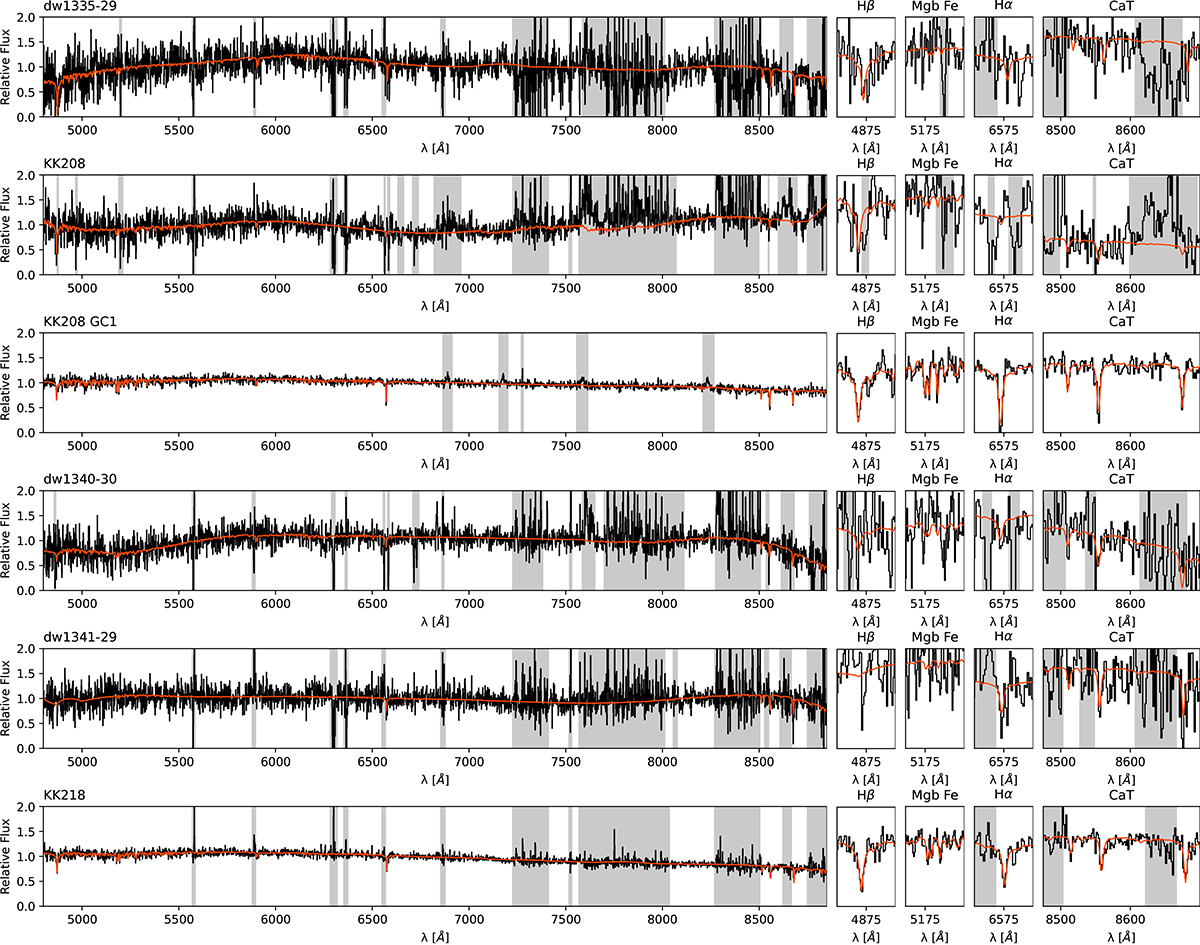
Spectra and zoom-ins around absorption lines of the observed dwarf galaxies. The spectra (black line) and the best fit from pPXF (red line) are plotted in the left panel over the full spectral coverage of MUSE. The gray areas indicate masked regions. The middle and right panels show the two most prominent absorption line regions to derive the velocities, namely the region around Hα and the Calcium Triplet (CaT).
Current usage metrics show cumulative count of Article Views (full-text article views including HTML views, PDF and ePub downloads, according to the available data) and Abstracts Views on Vision4Press platform.
Data correspond to usage on the plateform after 2015. The current usage metrics is available 48-96 hours after online publication and is updated daily on week days.
Initial download of the metrics may take a while.