Fig. 8.
Download original image
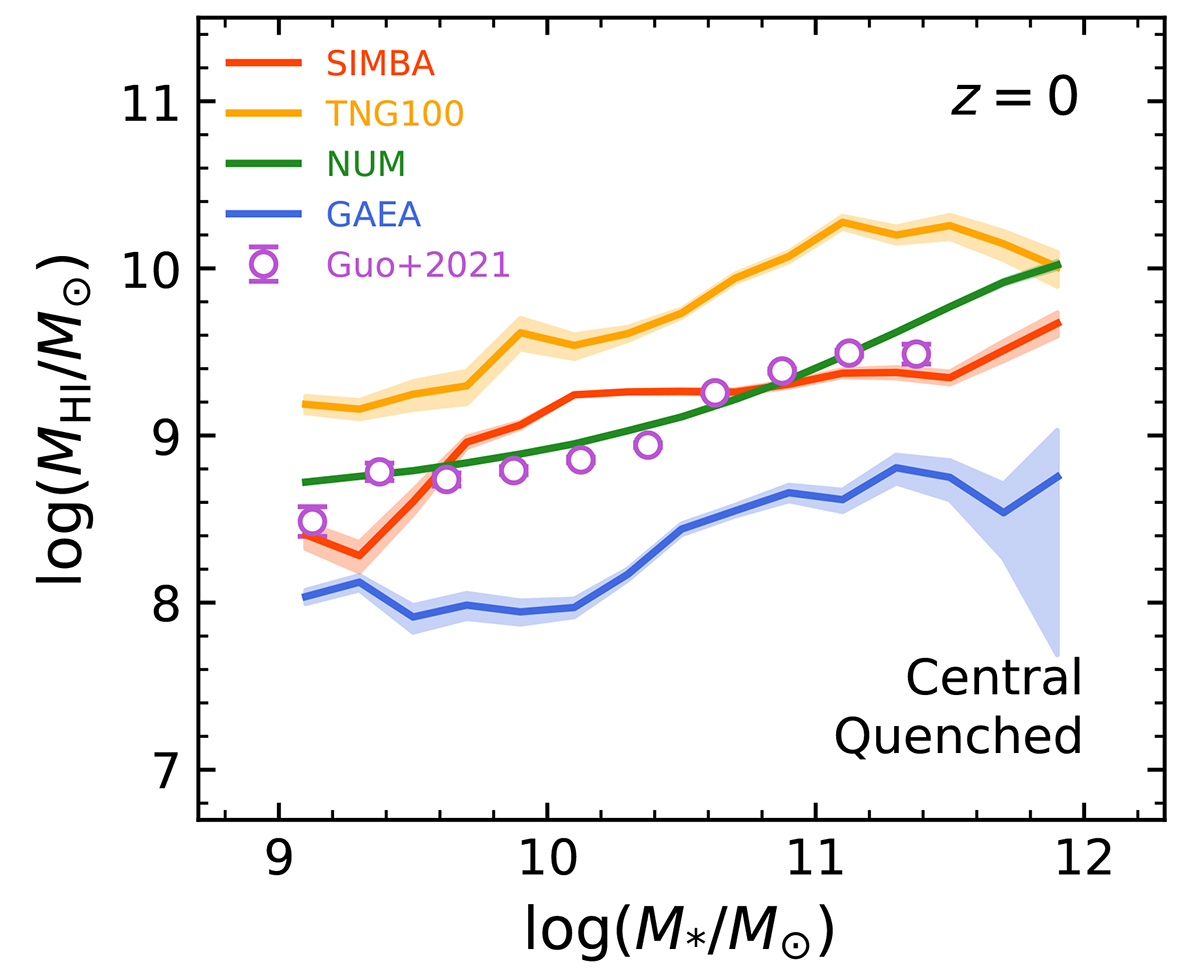
Comparisons between total H I mass and stellar mass of QGs in the different simulations and the observations. Solid lines represent the results obtained with the models, and the shaded area indicates the 1σ range calculated with bootstrap. The stacked H I-stellar mass results obtained by Guo et al. (2021) are indicated by open purple circles with error bars.
Current usage metrics show cumulative count of Article Views (full-text article views including HTML views, PDF and ePub downloads, according to the available data) and Abstracts Views on Vision4Press platform.
Data correspond to usage on the plateform after 2015. The current usage metrics is available 48-96 hours after online publication and is updated daily on week days.
Initial download of the metrics may take a while.