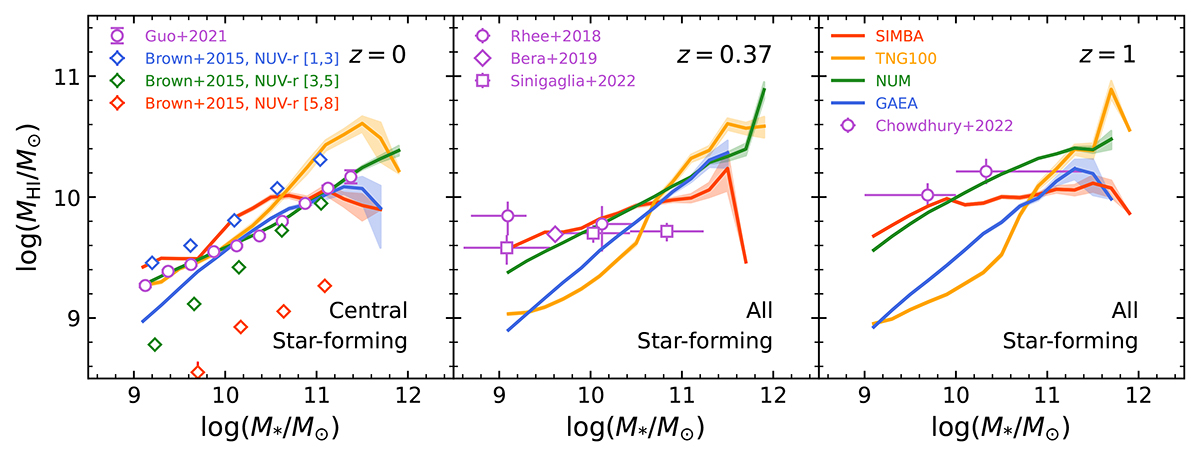
Fig. 7.
Download original image
Comparisons between total H I mass and stellar mass of SFGs in the different simulations and the observations. Solid lines and dots represent the models and the observations, respectively. The shaded area represents the 1σ range calculated with bootstrap. TNG100 and GAEA do not have a catalogue at z = 0.37, so we use the catalogue of z = 0.5 instead in the middle panel. Different columns represent different redshifts. The stacked H I-stellar mass results by Guo et al. (2021) are indicated by open purple circles in the left panel, as well as the stacked measurements of Brown et al. (2015) in different NUV−r colour bins (indicated by diamonds with different colours). Measurements of Rhee et al. (2018), Bera et al. (2019), and Sinigaglia et al. (2022) at z ∼ 0.37 are plotted as open circles, diamonds, and squares in the middle panel, respectively. Results of Chowdhury et al. (2022) generated from GMRT at z ∼ 1 are indicated by open purple circles in the right panel.
Current usage metrics show cumulative count of Article Views (full-text article views including HTML views, PDF and ePub downloads, according to the available data) and Abstracts Views on Vision4Press platform.
Data correspond to usage on the plateform after 2015. The current usage metrics is available 48-96 hours after online publication and is updated daily on week days.
Initial download of the metrics may take a while.