Fig. 6.
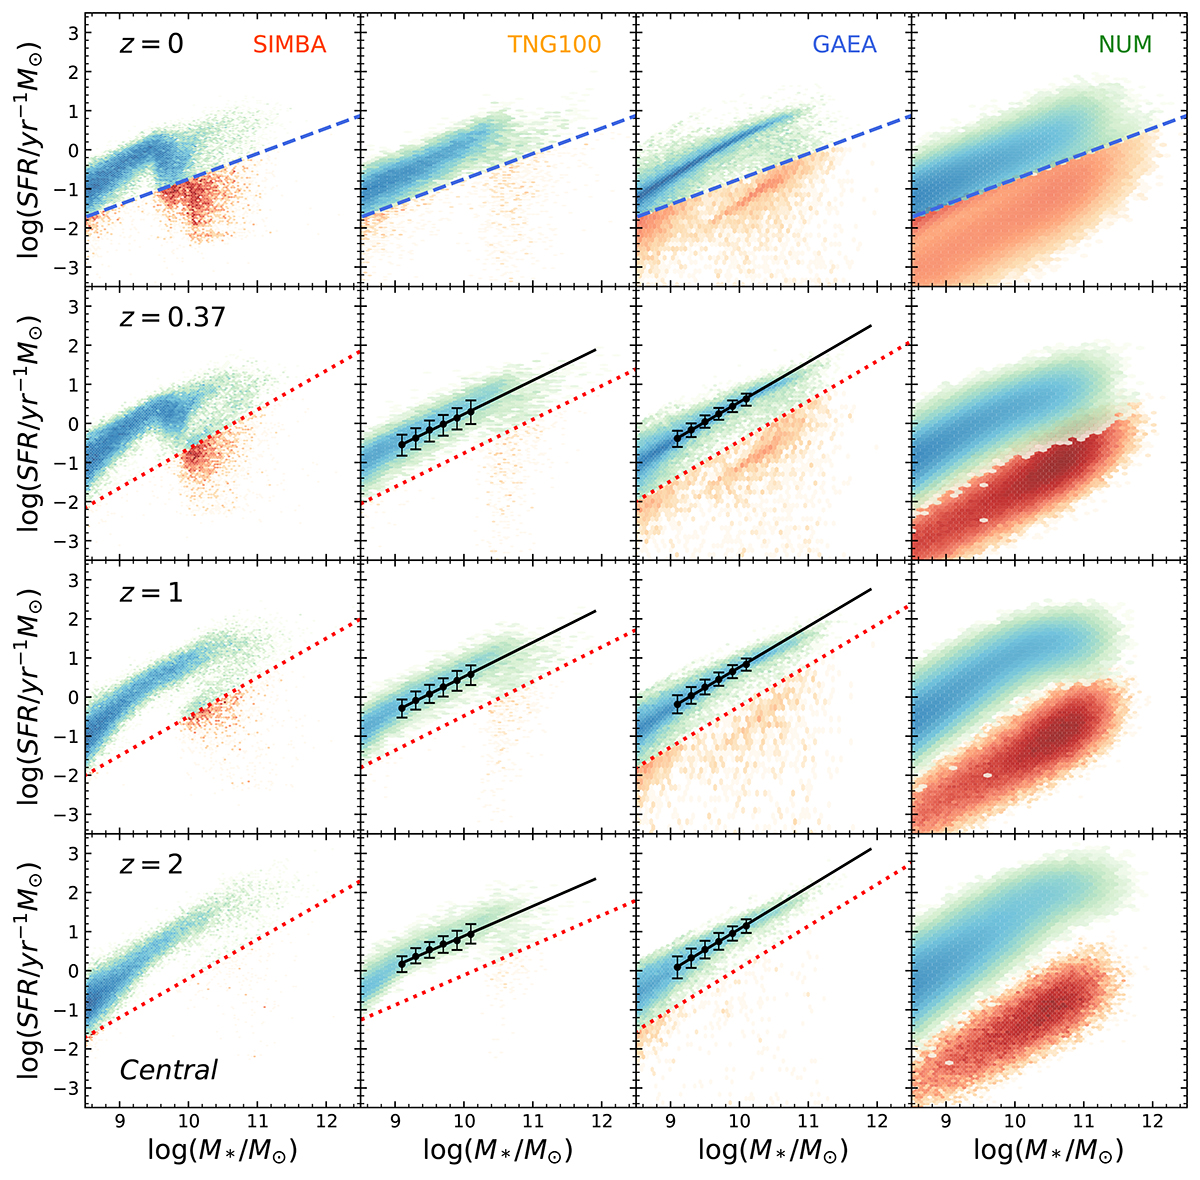
Download original image
Stellar mass and SFR relation in different simulations at various redshifts. The blue points represent the SFGs, and the red points represent the QGs. The top row shows the relation at z = 0, and the SFR cuts are plotted in dashed blue lines. We use the same SFR cut described in Equation (8) for equal comparison. The rows below show the relation at z = 0.37, 1, and 2, respectively. For SIMBA, TNG and GAEA, the SFR cuts follow the Equations (9)–(12) and are indicated by dotted red lines. As for NUM, we follow the same definition of the SFMS as in Eq. (5) of Guo et al. (2023), and use a cut at 1 dex below the SFMS.
Current usage metrics show cumulative count of Article Views (full-text article views including HTML views, PDF and ePub downloads, according to the available data) and Abstracts Views on Vision4Press platform.
Data correspond to usage on the plateform after 2015. The current usage metrics is available 48-96 hours after online publication and is updated daily on week days.
Initial download of the metrics may take a while.