Fig. 5.
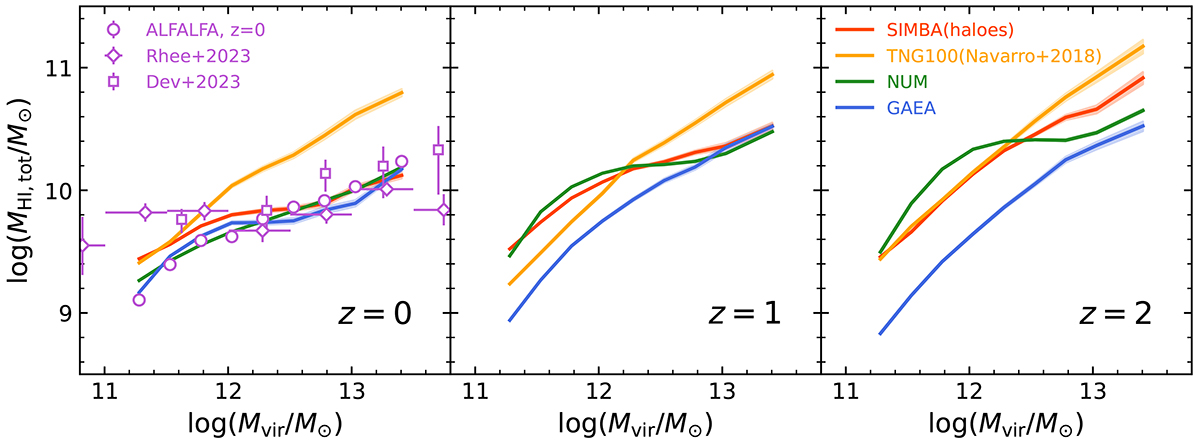
Download original image
Comparisons between total H I mass and halo mass in the different simulations and the observations. Solid lines and dots represent the models and the observations, respectively. The shaded area represents the 1σ error range calculated with the bootstrapping method. Different columns represent different redshifts. Measurements of the H I-halo mass relation at z = 0 with confusion correction in Guo et al. (2020) are shown as open purple circles, while the measurements from Rhee et al. (2023) and Dev et al. (2023) for haloes with at least two member galaxies are plotted as purple diamonds and squares, respectively. We include all the H I in the galaxies and the IGM as in Figure 2; therefore, we employ the results of Villaescusa-Navarro et al. (2018) for TNG and use H I in haloes for SIMBA.
Current usage metrics show cumulative count of Article Views (full-text article views including HTML views, PDF and ePub downloads, according to the available data) and Abstracts Views on Vision4Press platform.
Data correspond to usage on the plateform after 2015. The current usage metrics is available 48-96 hours after online publication and is updated daily on week days.
Initial download of the metrics may take a while.