Fig. 4.
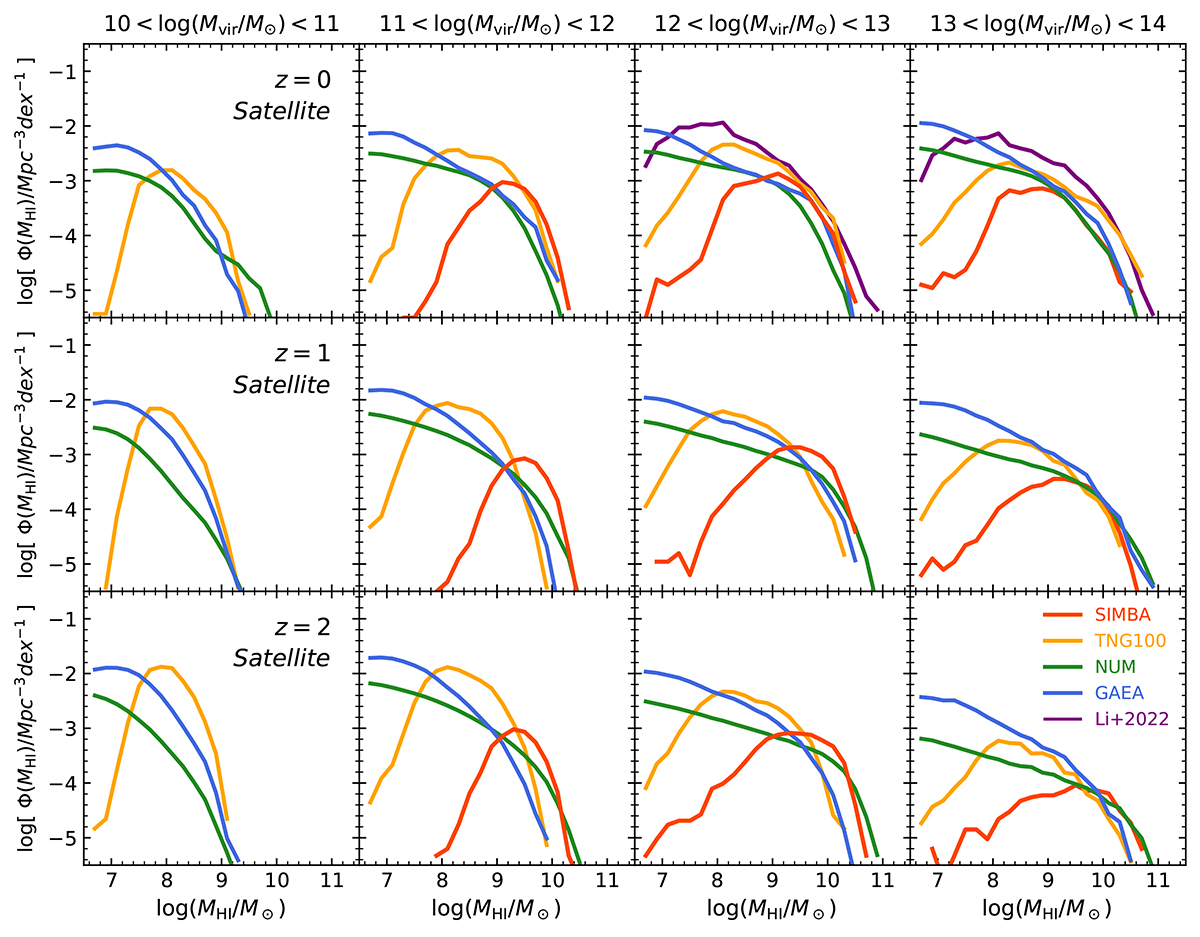
Download original image
Comparisons between the CHIMF of satellite galaxies from the different simulations. The labels are the same as in Figure 1. Results from Li et al. (2022) are plotted in solid purple lines. Within the mass interval 12 < log(Mvir/M⊙) < 14, the halo count in GAEA is similar to that in SIMBA, whereas TNG has only about 50% as many as SIMBA.
Current usage metrics show cumulative count of Article Views (full-text article views including HTML views, PDF and ePub downloads, according to the available data) and Abstracts Views on Vision4Press platform.
Data correspond to usage on the plateform after 2015. The current usage metrics is available 48-96 hours after online publication and is updated daily on week days.
Initial download of the metrics may take a while.