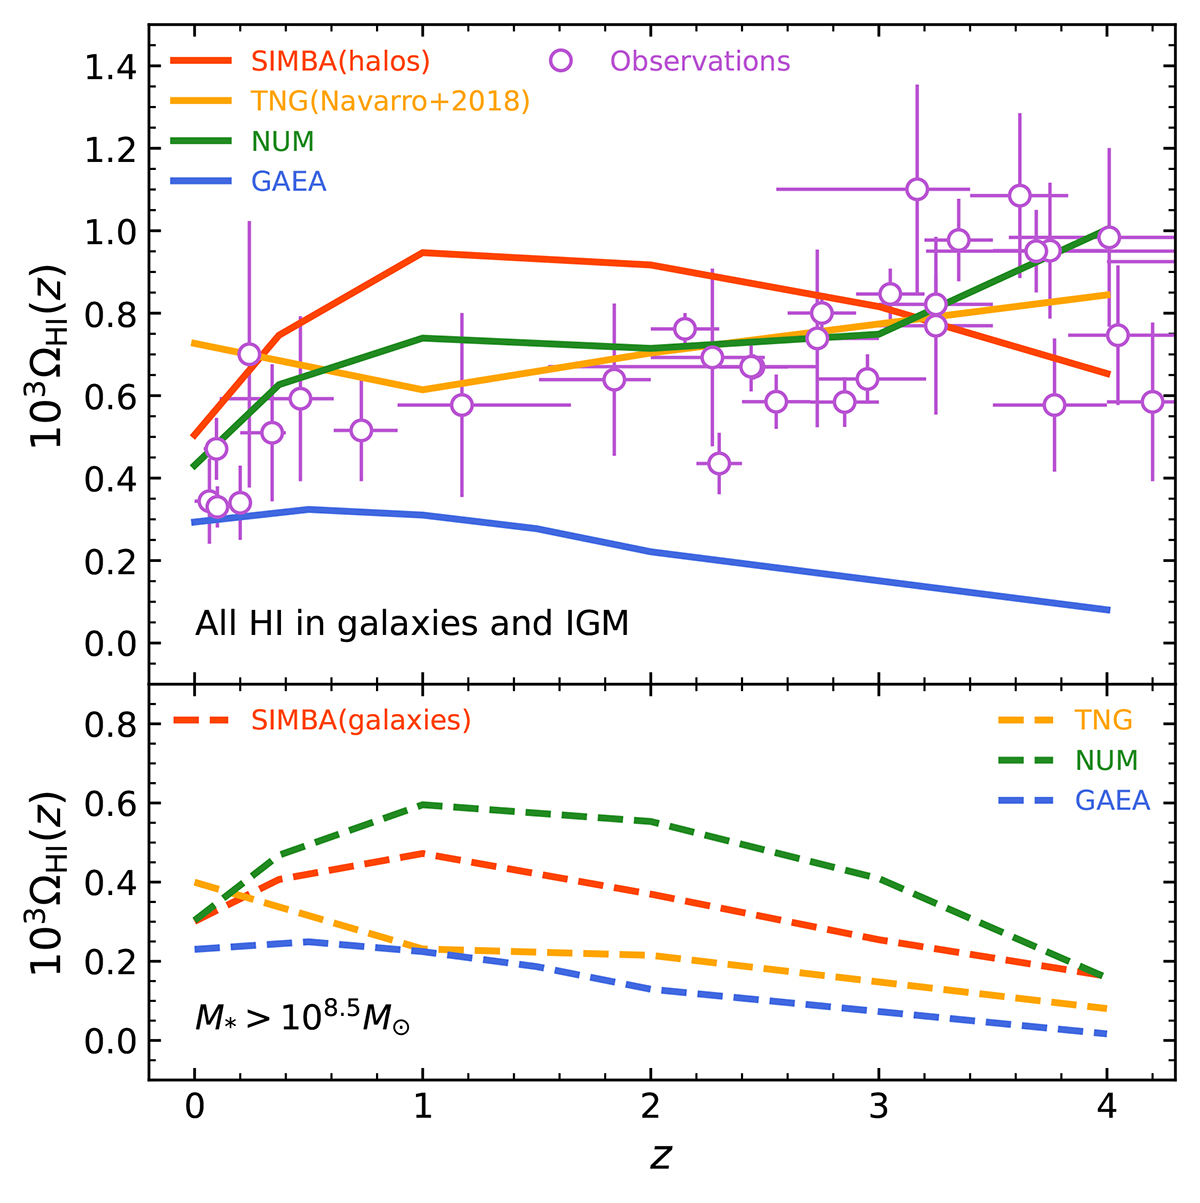
Fig. 2.
Download original image
Comparisons between H I fraction, ΩH I(z), from different simulations (solid lines) and observational data (open circles) from Lah et al. (2007), Guimarães et al. (2009), Prochaska & Wolfe (2009), Noterdaeme et al. (2012), Delhaize et al. (2013), Rhee et al. (2013), Zafar et al. (2013), Crighton et al. (2015), Hoppmann et al. (2015), Sánchez-Ramírez et al. (2016), Rao et al. (2017), Bera et al. (2019). For further details, see Table 2 of Walter et al. (2020). The top panel shows all the H I in the galaxies and the IGM with no selection. We refer to Fig. 4 of Guo et al. (2023) for more details about the observations. The bottom panel shows ΩH I of different theoretical models with a mass threshold of M* > 108.5 M⊙ (dashed lines). The labels are the same as in Figure 1.
Current usage metrics show cumulative count of Article Views (full-text article views including HTML views, PDF and ePub downloads, according to the available data) and Abstracts Views on Vision4Press platform.
Data correspond to usage on the plateform after 2015. The current usage metrics is available 48-96 hours after online publication and is updated daily on week days.
Initial download of the metrics may take a while.