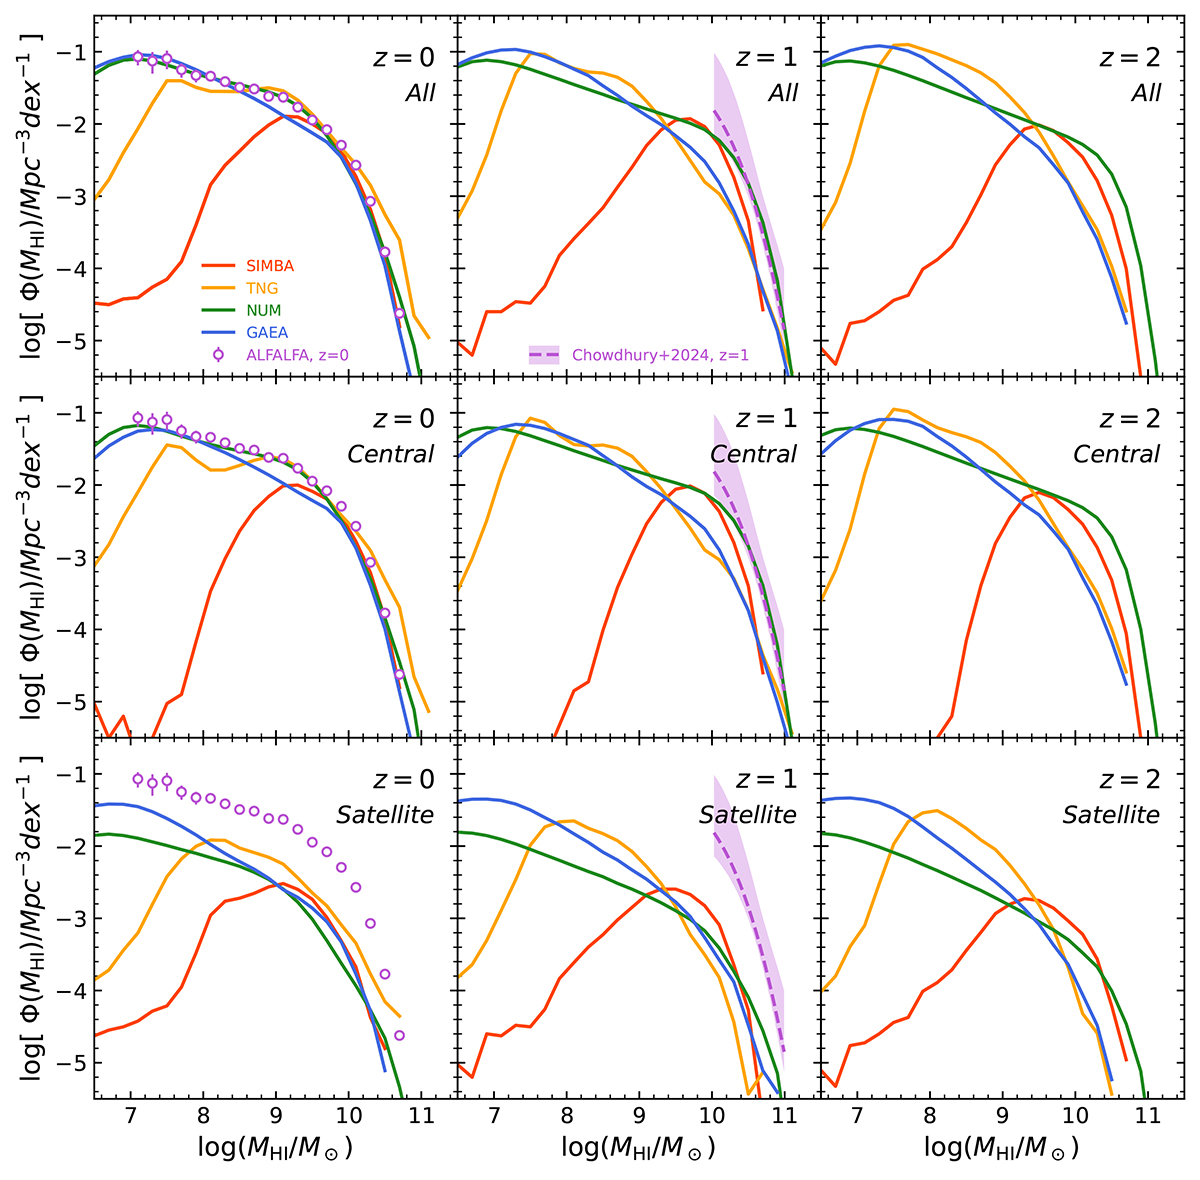
Fig. 1.
Download original image
Comparisons between the HIMF of the different simulations and the observations. Solid lines represent the models, and the observations for all galaxies at z ∼ 0 are shown in open purple dots. The results of all the SFGs at z ∼ 1 from Chowdhury et al. (2024) are plotted in dashed lines, and the 1σ errors are indicated by the shaded region. The high-mass range of the HIMF is largely contributed by SFGs; therefore, the SFG results at z ∼ 1 would be similar to those for the entire galaxy population. The top row represents the HIMF for all galaxies, and the middle and bottom rows show the HIMF for the central and satellite galaxies, respectively. Different columns represent different redshifts.
Current usage metrics show cumulative count of Article Views (full-text article views including HTML views, PDF and ePub downloads, according to the available data) and Abstracts Views on Vision4Press platform.
Data correspond to usage on the plateform after 2015. The current usage metrics is available 48-96 hours after online publication and is updated daily on week days.
Initial download of the metrics may take a while.