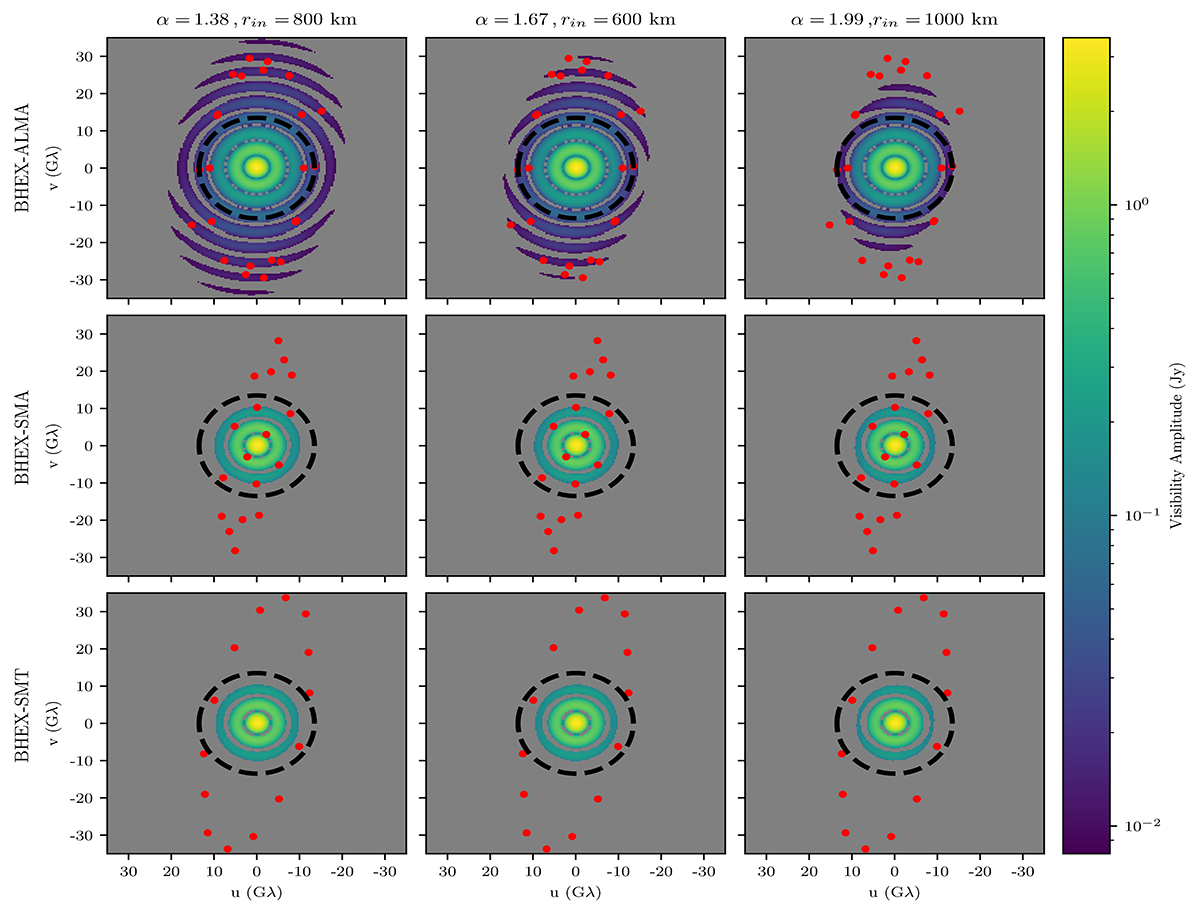
Fig. 3.
Download original image
Total flux for the BHEX-ALMA, BHEX-SMA and BHEX-SMT baselines for various values of α and rin. The colored and gray regions represent the accessible and inaccessible flux, with the floor set by the thermal noise for the corresponding baseline. The red dots represent the (u, v) coverage for the baseline and the black circle is at 13.5 Gλ which represents the boundary for our model beyond which the photon ring in linear polarization is expected to dominate. The colored region represents the flux signal lying above the detection threshold of 3σ for each baseline.
Current usage metrics show cumulative count of Article Views (full-text article views including HTML views, PDF and ePub downloads, according to the available data) and Abstracts Views on Vision4Press platform.
Data correspond to usage on the plateform after 2015. The current usage metrics is available 48-96 hours after online publication and is updated daily on week days.
Initial download of the metrics may take a while.