Fig. 7.
Download original image
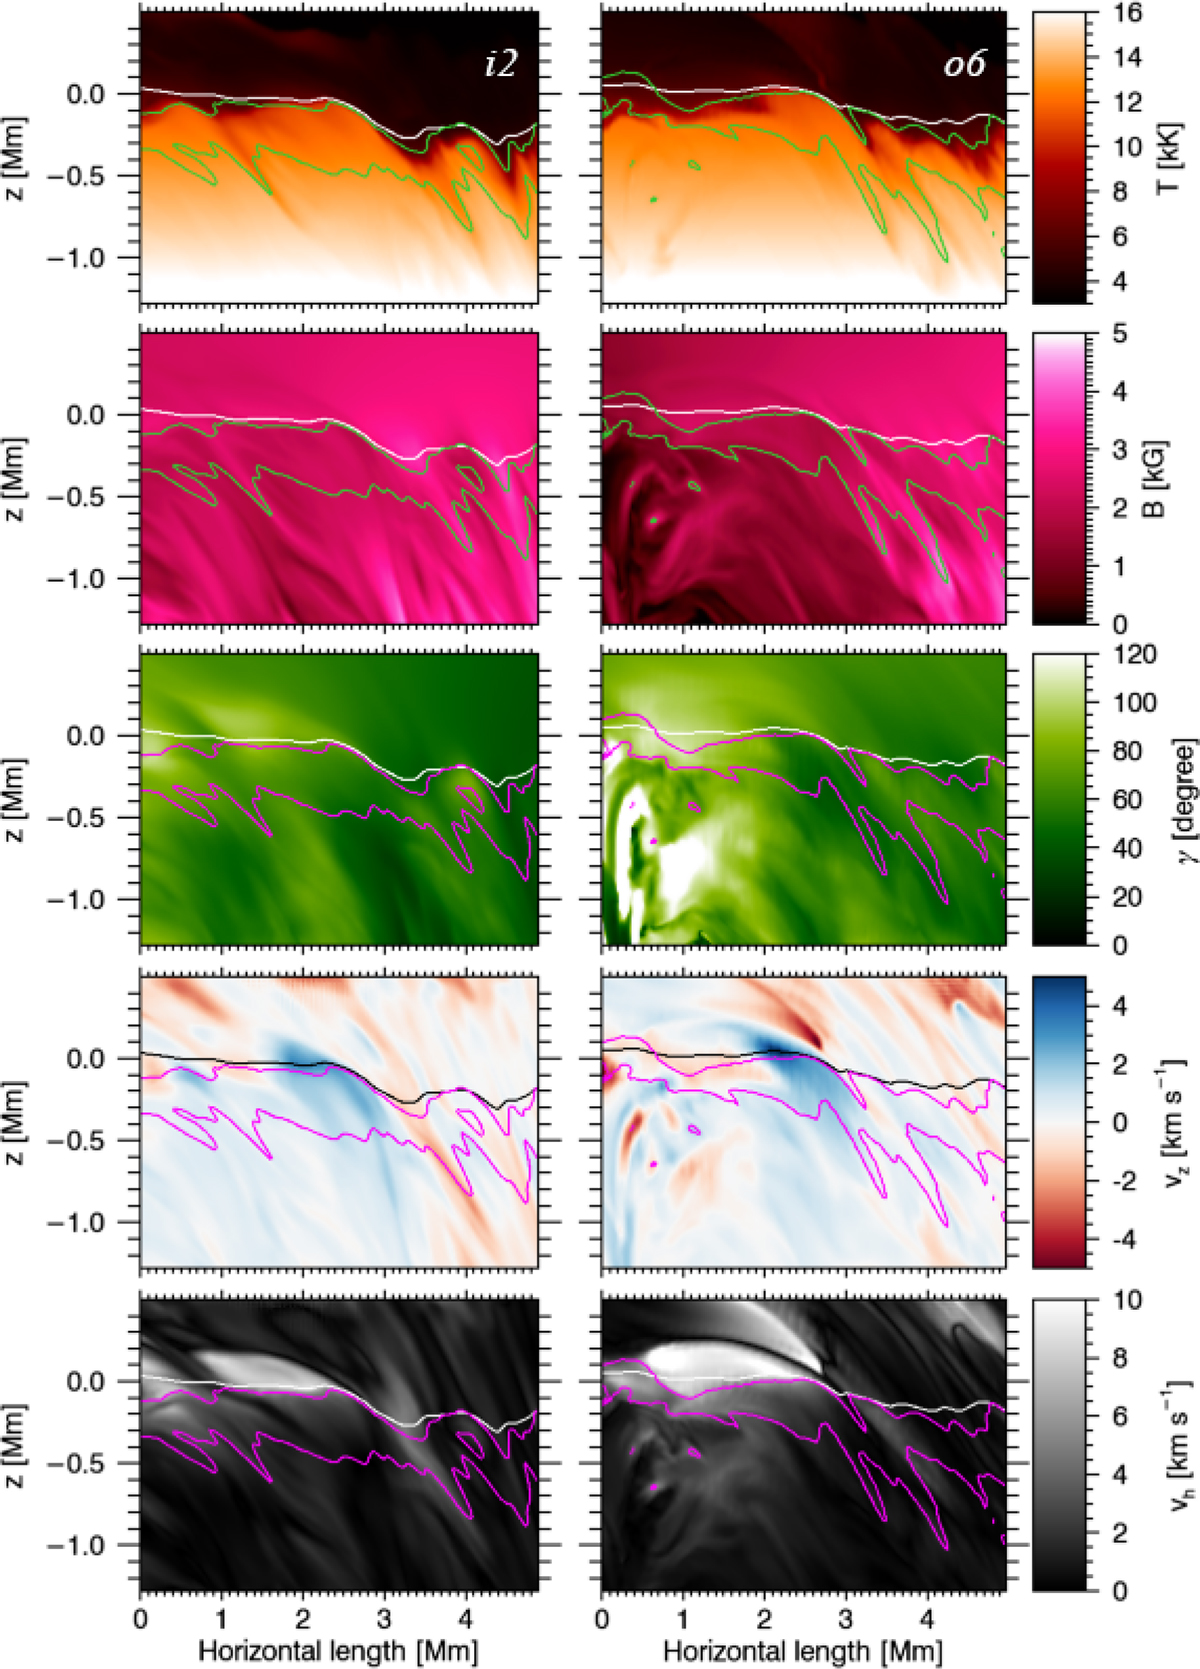
Two examples of static vertical cuts across PGs i2 (left) and o6 (right) in temperature T, magnetic field strength B, magnetic inclination γ, vertical velocity component vz, and horizontal velocity component vh. Solid white or black lines correspond to τ500nm = 1, while green or magenta lines correspond to contours of plasma β = 1 and 5. Upward-directed vertical velocities are positive (blue). Figures of all 15 vertical cuts are available on zenodo.
Current usage metrics show cumulative count of Article Views (full-text article views including HTML views, PDF and ePub downloads, according to the available data) and Abstracts Views on Vision4Press platform.
Data correspond to usage on the plateform after 2015. The current usage metrics is available 48-96 hours after online publication and is updated daily on week days.
Initial download of the metrics may take a while.