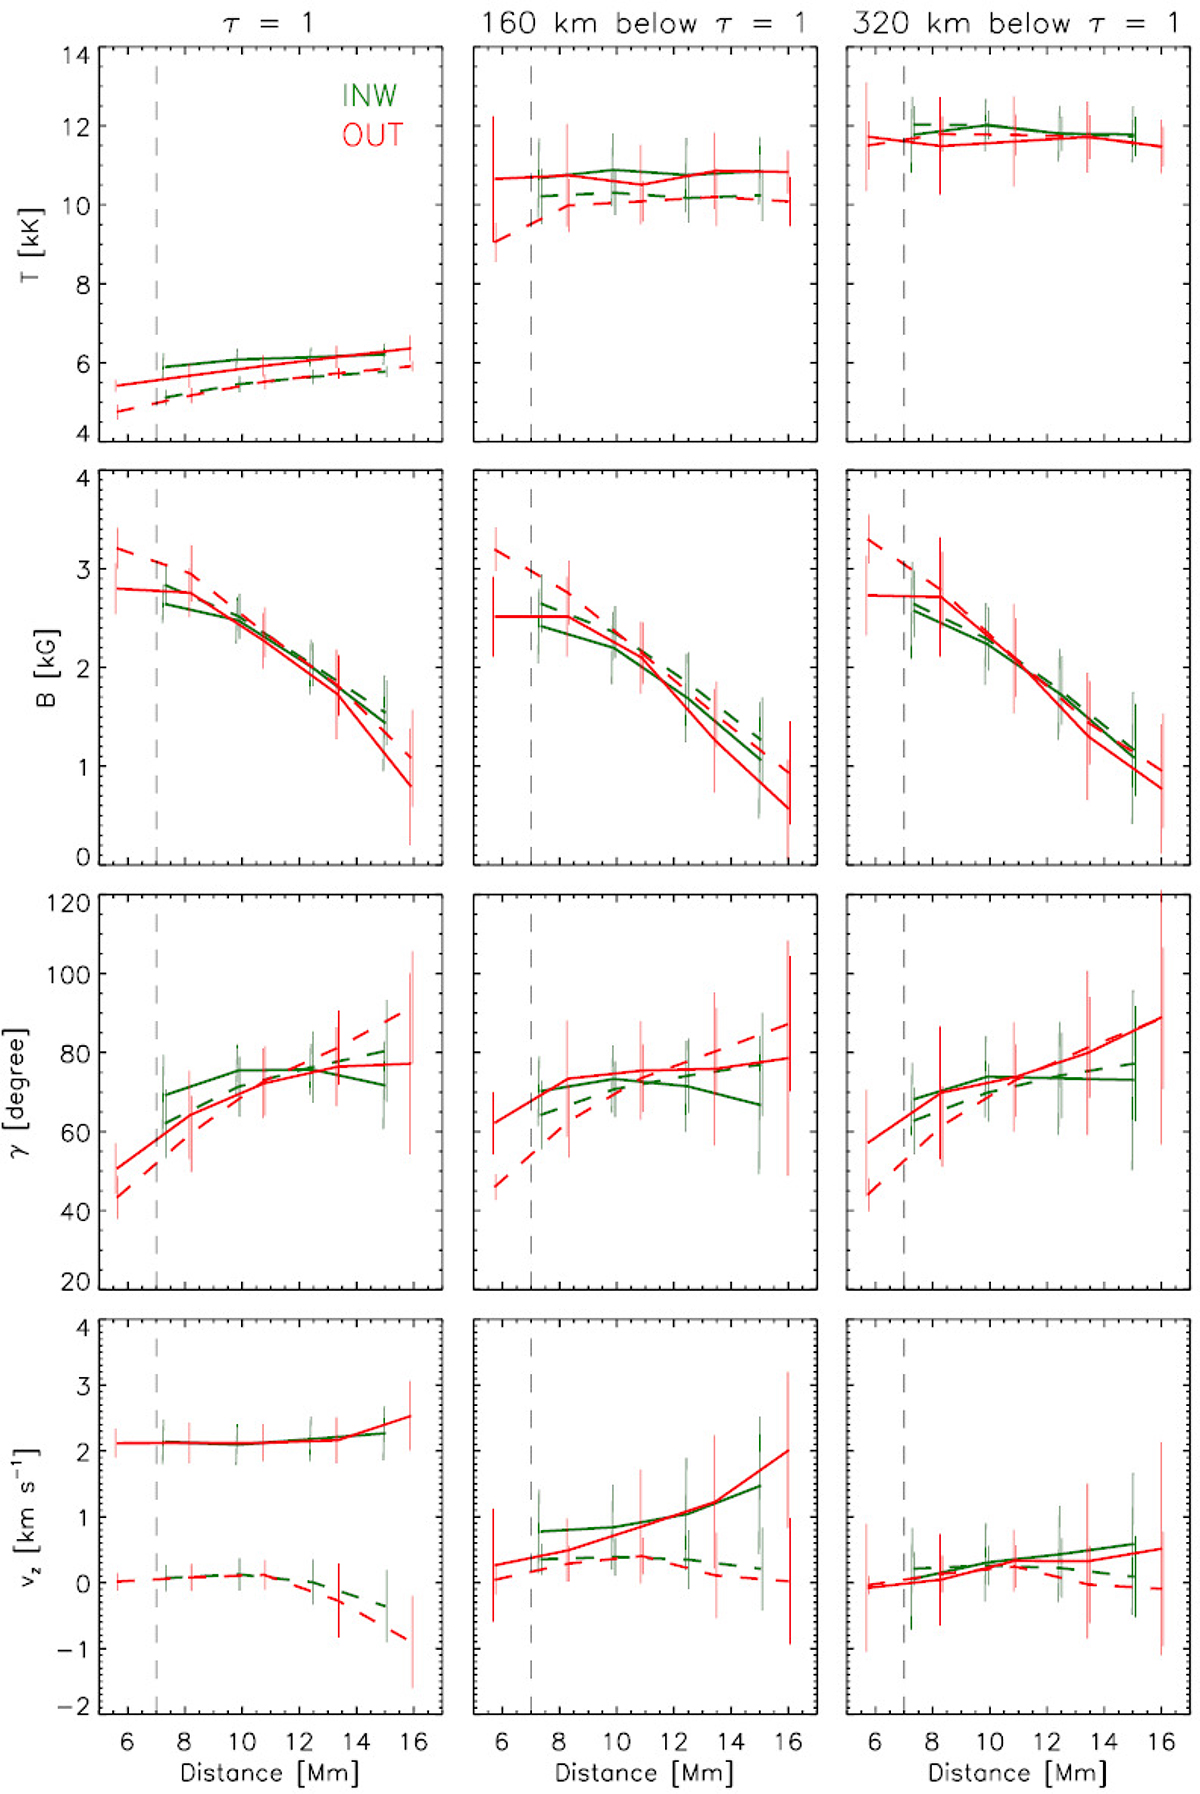
Fig. 4.
Download original image
Mean values and standard deviations of temperature T, magnetic field strength B, inclination γ, and vertical velocity vz versus radial distance from the spot centre at the visible surface, τ500nm = 1 (first column), and in two slices 160 km (second column) and 320 km (third column) below it. The values were averaged in 2.5 Mm wide sections of the radial distance. Solid lines represent the values in PGs, dashed in their surroundings. Green and red colours correspond to INW and OUT PGs, respectively. The vertical dashed lines mark the umbra-penumbra border typical for observed circular sunspots.
Current usage metrics show cumulative count of Article Views (full-text article views including HTML views, PDF and ePub downloads, according to the available data) and Abstracts Views on Vision4Press platform.
Data correspond to usage on the plateform after 2015. The current usage metrics is available 48-96 hours after online publication and is updated daily on week days.
Initial download of the metrics may take a while.