Fig. 3.
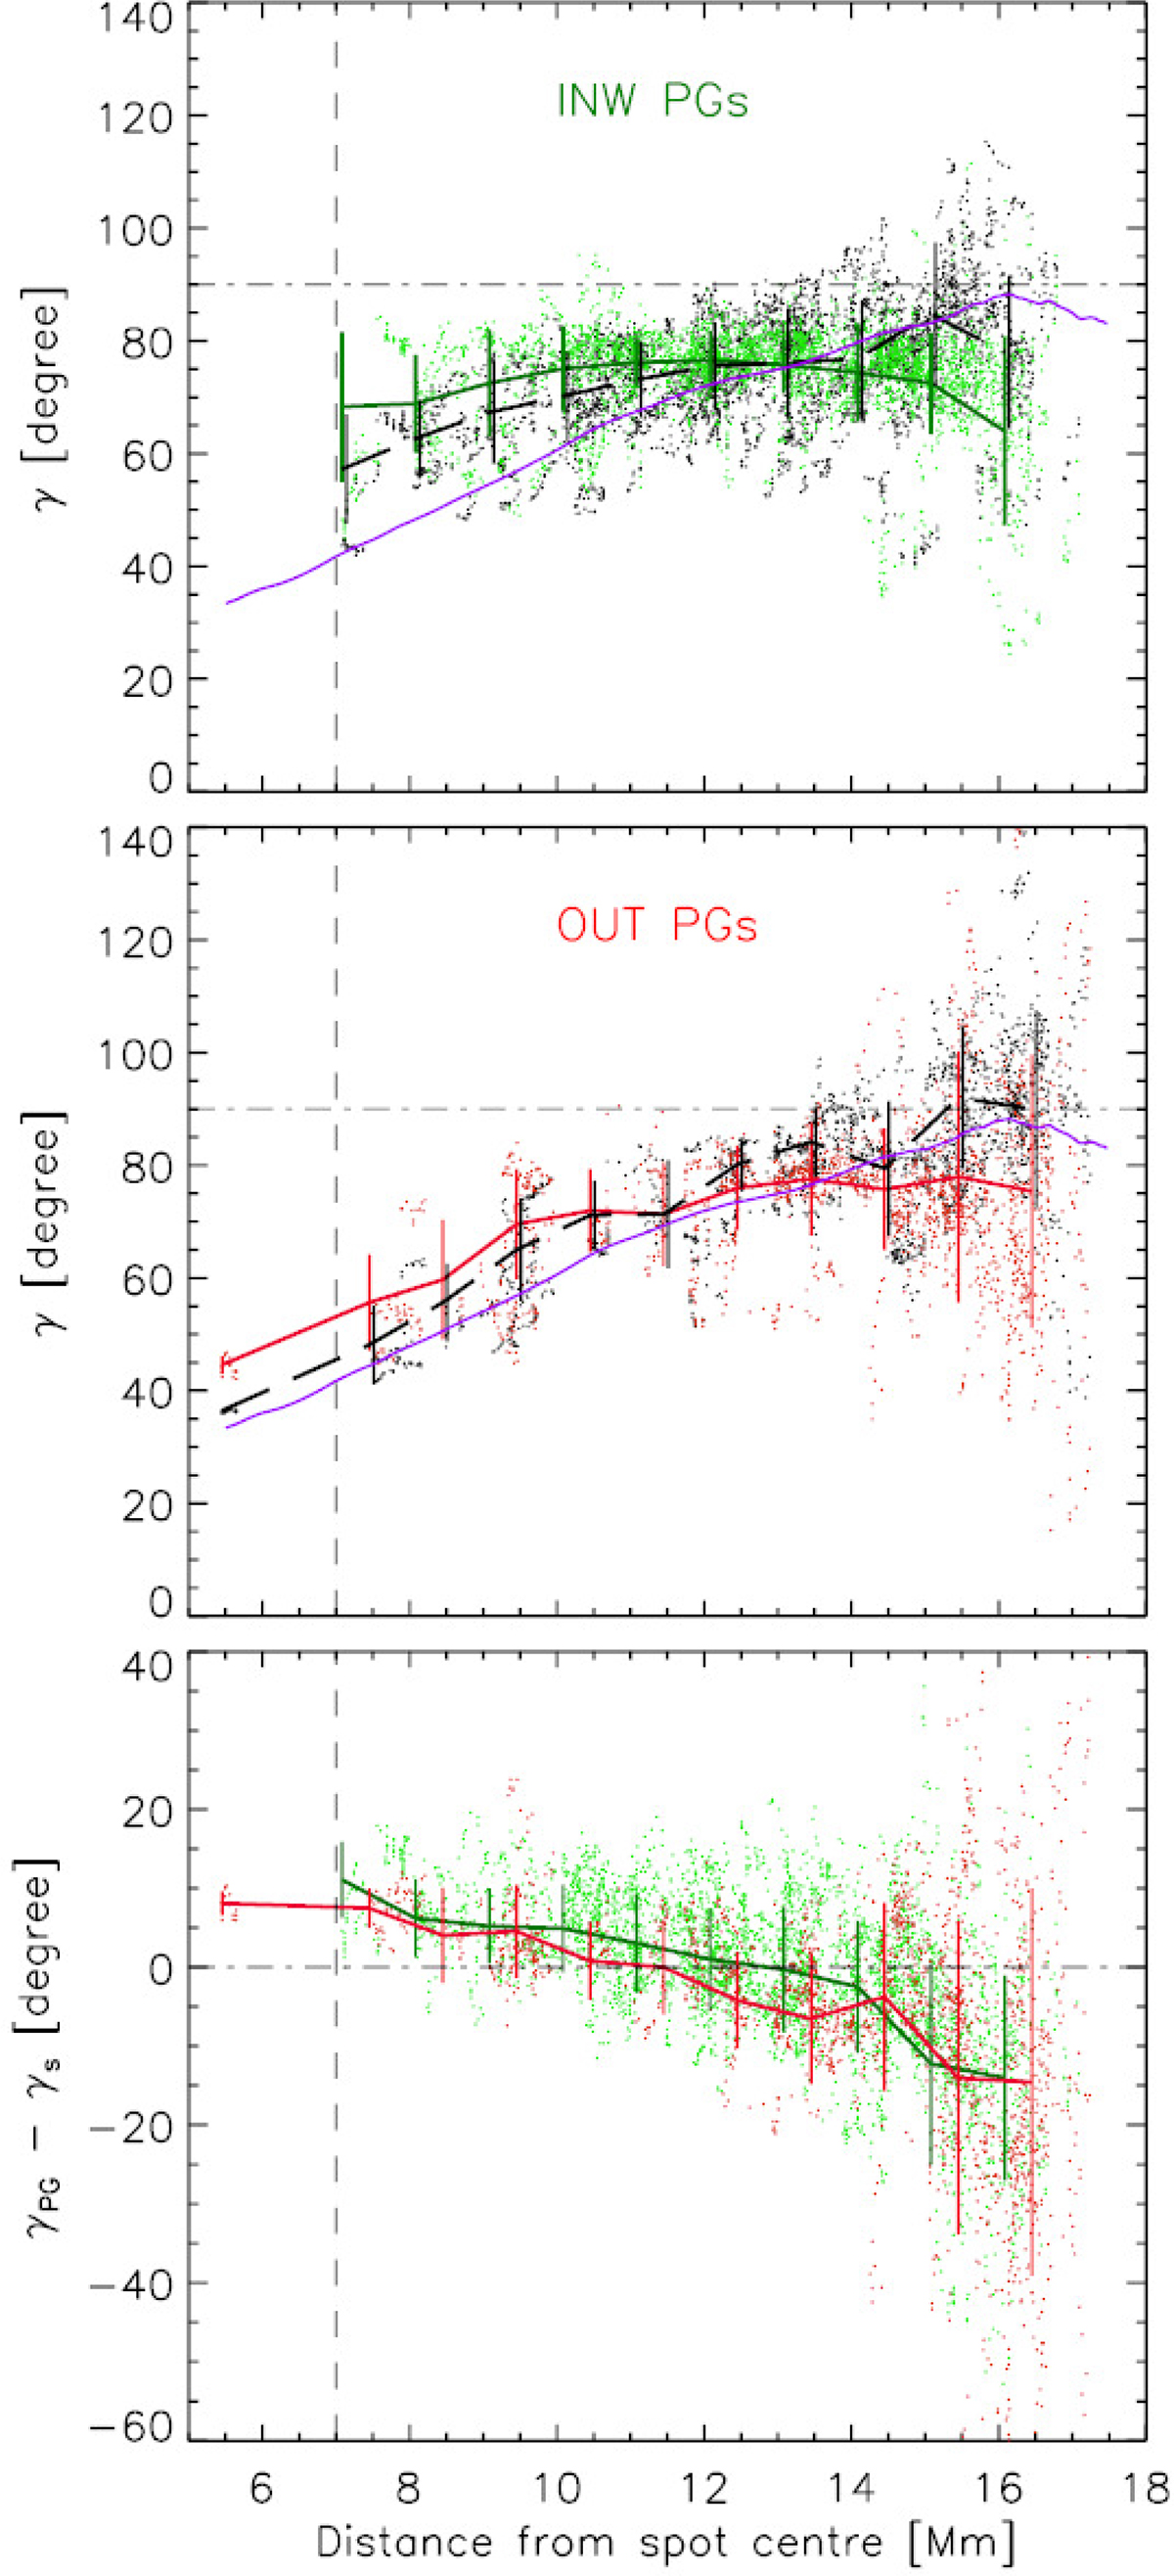
Download original image
Scatter plots of magnetic inclinations, γ, versus radial distance from the spot centre in individual occurrences of PGs (green – inward-moving, top panel; red – outward-moving, middle panel) and in their surroundings (black) at τ500nm = 1. Lines with error bars were obtained by averaging the values in 1 Mm wide sections of the radial distance. Magenta lines represent the azimuthally averaged magnetic field inclination. The vertical dashed lines mark the umbra-penumbra border typical for observed circular sunspots (0.4 rspot). The bottom panel shows differences between the inclinations in INW and OUT PGs and their surroundings, averages, and standard deviations.
Current usage metrics show cumulative count of Article Views (full-text article views including HTML views, PDF and ePub downloads, according to the available data) and Abstracts Views on Vision4Press platform.
Data correspond to usage on the plateform after 2015. The current usage metrics is available 48-96 hours after online publication and is updated daily on week days.
Initial download of the metrics may take a while.