Fig. 6.
Download original image
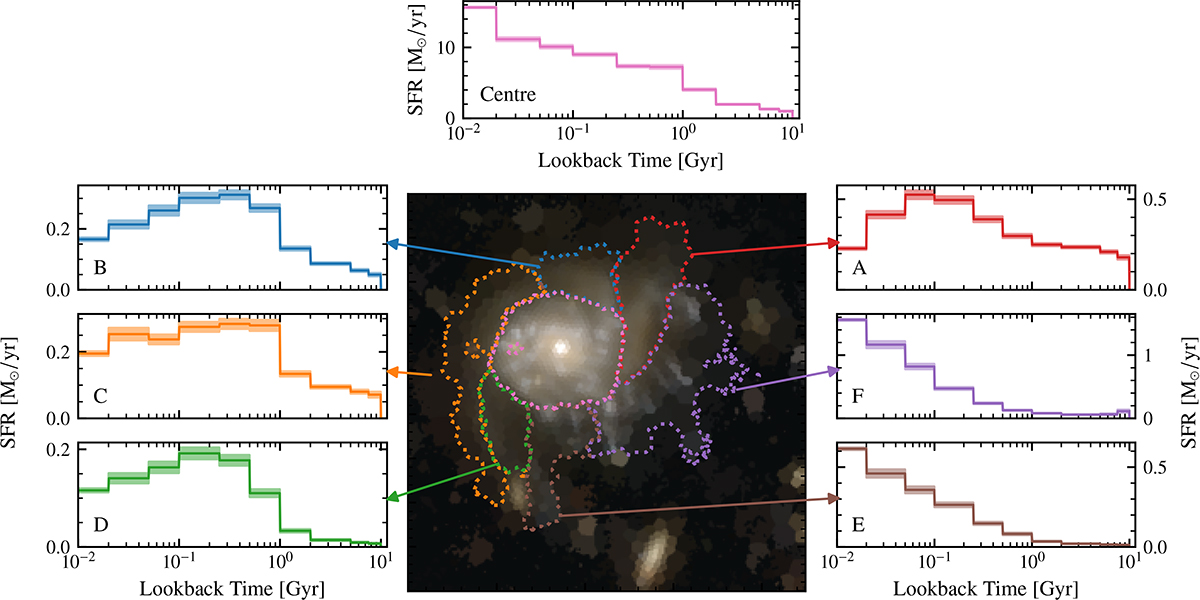
(Centre panel) RGB image of F0083, using the same filters as in Fig. 1, constructed from the Voronoi-binned PSF-matched images. (Outer panels) SFH in the central and exterior regions of the galaxy, derived as the sum of the individual SFHs of all bins in that region. The region label (A-F) is inset. We note that the SFR is plotted on a logarithmic scale, in contrast with Fig. 3, and hence the area under the line no longer directly represents the total stellar mass formed in a given temporal range. We also note that whilst the youngest age bin spans 0−20 Myr, for clarity we have truncated the displayed range to only show tL≥10 Myr.
Current usage metrics show cumulative count of Article Views (full-text article views including HTML views, PDF and ePub downloads, according to the available data) and Abstracts Views on Vision4Press platform.
Data correspond to usage on the plateform after 2015. The current usage metrics is available 48-96 hours after online publication and is updated daily on week days.
Initial download of the metrics may take a while.