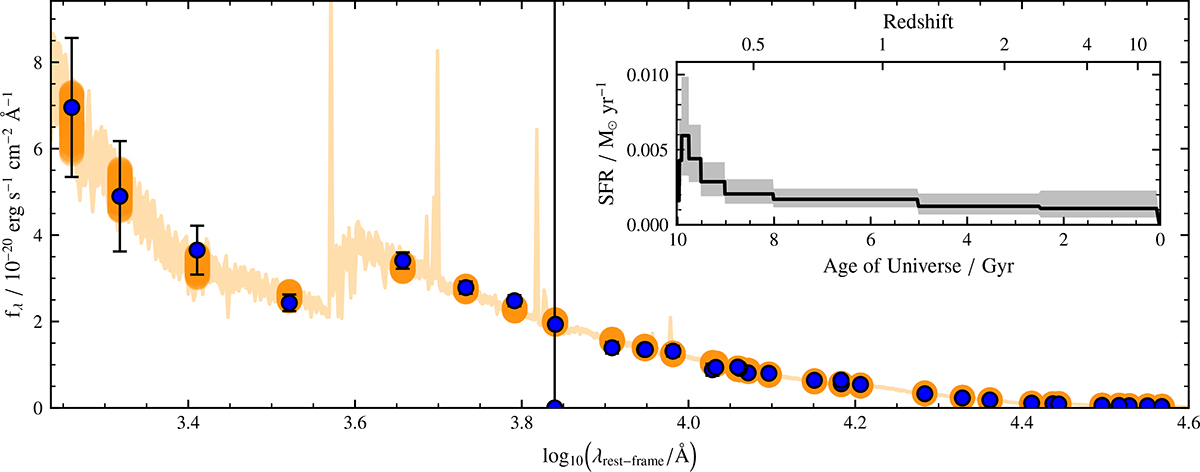
Fig. 3.
Download original image
Example BAGPIPES fit to the photometry in a single Voronoi bin, plotted against the rest-frame wavelengths. The blue points indicate the measured flux at the pivot point of each filter, with their uncertainty (including the additional systematic component; see Appendix C). The shaded orange region indicates the 16th–84th percentile of the model spectrum, and the orange points the corresponding predicted fluxes in each filter. In the inset, we show the derived SFH of this region as a function of both redshift and the age of the Universe, with the shaded region denoting the 16th–84th percentile of the posterior PDF in each age bin.
Current usage metrics show cumulative count of Article Views (full-text article views including HTML views, PDF and ePub downloads, according to the available data) and Abstracts Views on Vision4Press platform.
Data correspond to usage on the plateform after 2015. The current usage metrics is available 48-96 hours after online publication and is updated daily on week days.
Initial download of the metrics may take a while.