Fig. 2.
Download original image
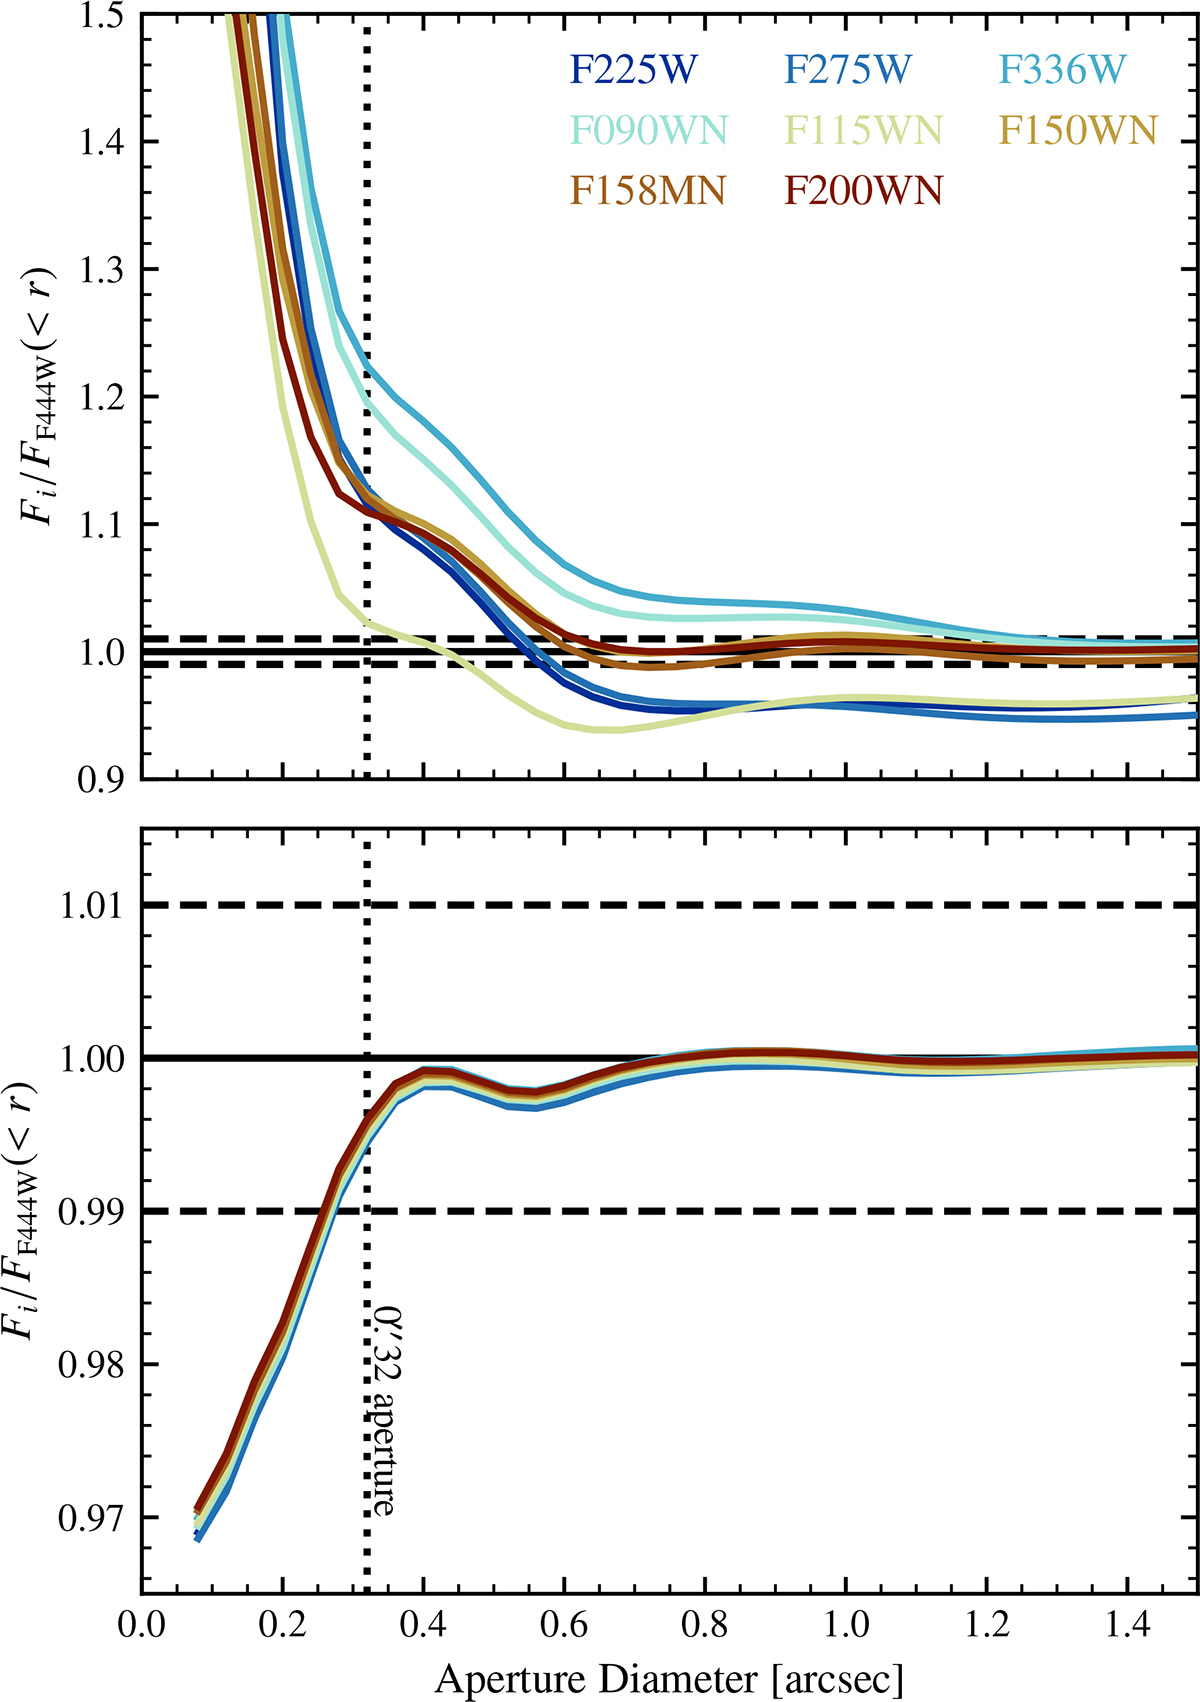
PSF curve of growth for each filter in our analysis, before (top) and after (bottom) matching to the F444W PSF. The curves are shown as the encircled flux relative to the F444W growth curve, where unity would imply an exact match. The solid black line indicates an exact match, the dashed lines the ±1% deviations from this, and the dotted line the location of a 0![]() 32 aperture, for ease of comparison with the growth curves shown in Weaver et al. (2024) and Suess et al. (2024).
32 aperture, for ease of comparison with the growth curves shown in Weaver et al. (2024) and Suess et al. (2024).
Current usage metrics show cumulative count of Article Views (full-text article views including HTML views, PDF and ePub downloads, according to the available data) and Abstracts Views on Vision4Press platform.
Data correspond to usage on the plateform after 2015. The current usage metrics is available 48-96 hours after online publication and is updated daily on week days.
Initial download of the metrics may take a while.