Fig. E.1.
Download original image
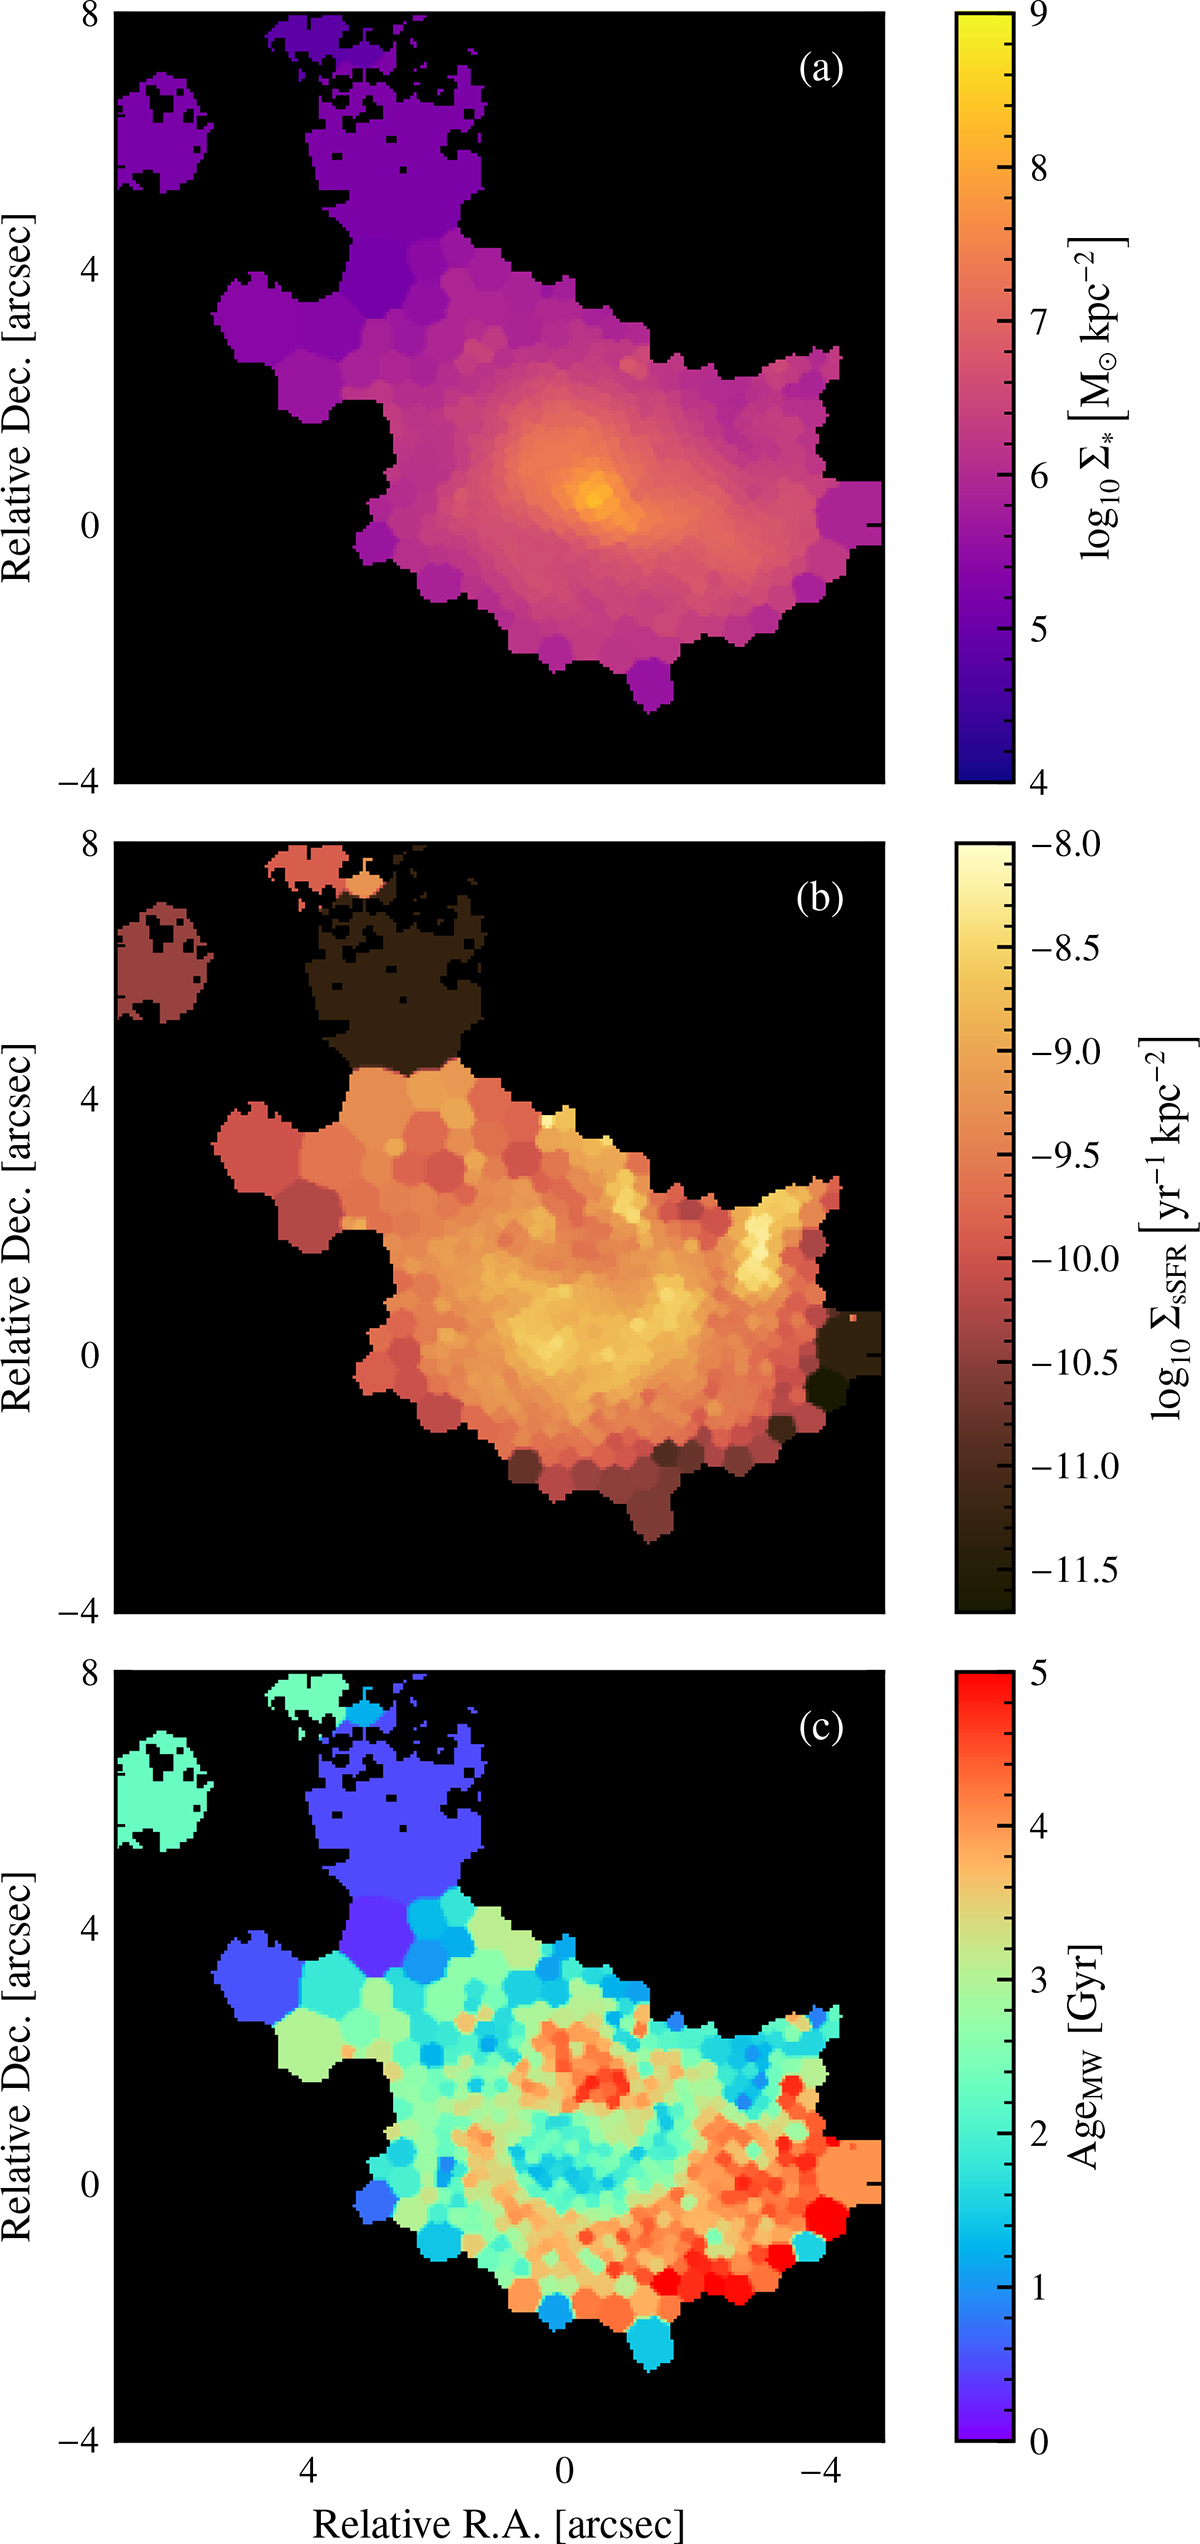
(a) Spatially resolved map of the stellar mass surface density for 29 959, with all external objects masked out. The discontinuity in the tail is due to the very low S/N in this area. (b) Specific star formation rate density. We note that the lower limit of the colour map differs from Fig. 5, in order to preserve as much detail as possible. (c) Mass-weighted age, AgeMW, expressed on a linear scale in units of Gyr.
Current usage metrics show cumulative count of Article Views (full-text article views including HTML views, PDF and ePub downloads, according to the available data) and Abstracts Views on Vision4Press platform.
Data correspond to usage on the plateform after 2015. The current usage metrics is available 48-96 hours after online publication and is updated daily on week days.
Initial download of the metrics may take a while.