Fig. 9
Download original image
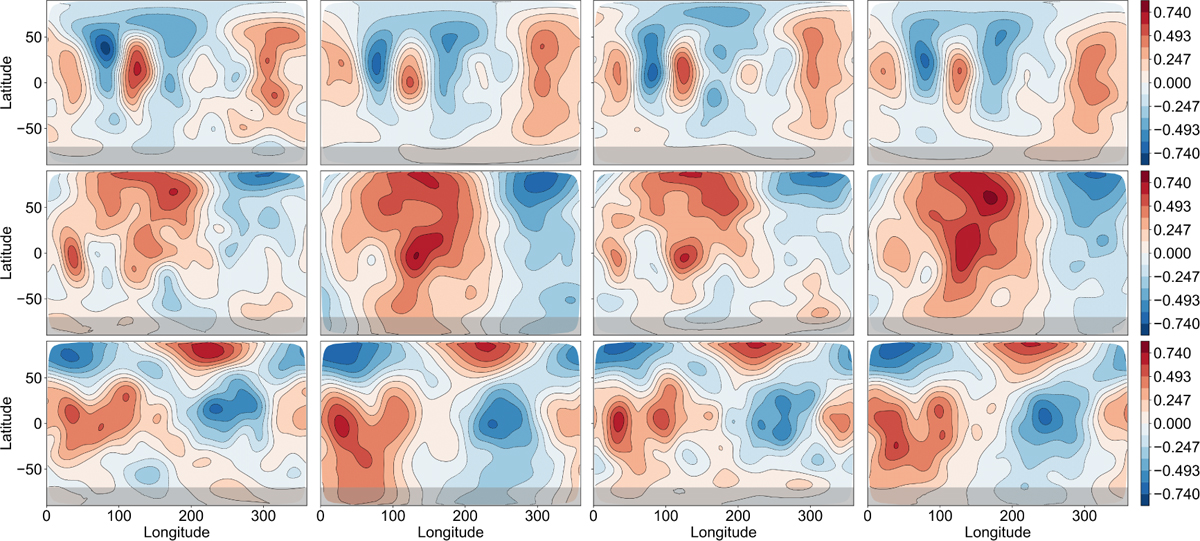
Same as Fig. 7 but the four samples were drawn from the posterior magnetic field distribution obtained through posterior inference using a statistical model with a mixture prior consisting of the two components p1(z) and p2(z). From the left, the first and third column represent samples drawn from the first component of the mixture posterior, and the second and fourth column represent samples drawn from the second component.
Current usage metrics show cumulative count of Article Views (full-text article views including HTML views, PDF and ePub downloads, according to the available data) and Abstracts Views on Vision4Press platform.
Data correspond to usage on the plateform after 2015. The current usage metrics is available 48-96 hours after online publication and is updated daily on week days.
Initial download of the metrics may take a while.