Fig. 7
Download original image
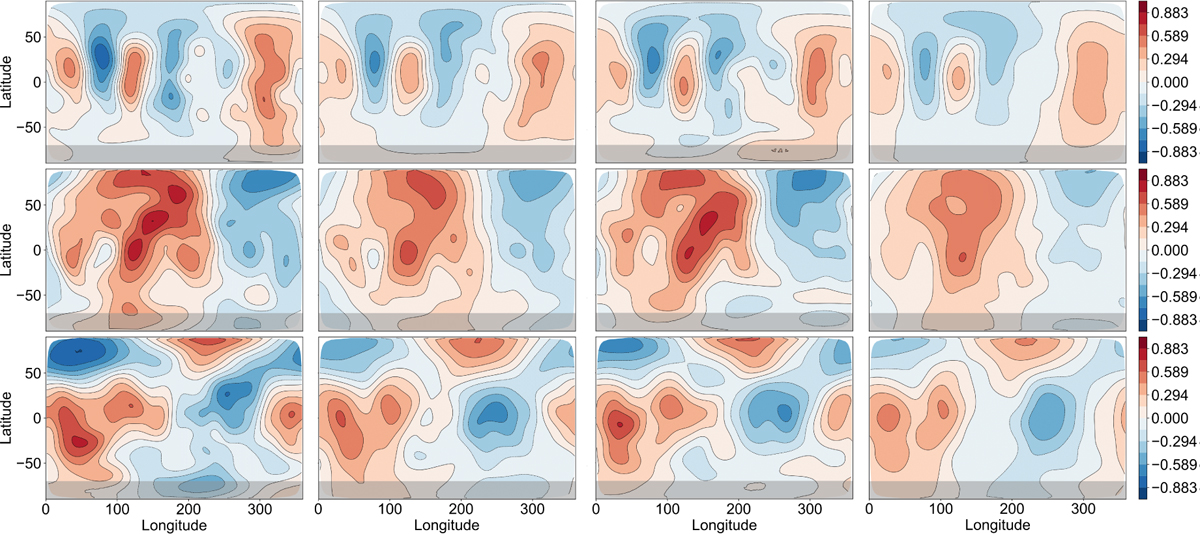
Four samples of surface magnetic field vector maps drawn from the posterior distribution. The distribution was obtained through posterior inference using a statistical model with a mixture prior consisting of 1000 η-dependent components pc(z). From the left, the samples were drawn from components of the mixture posterior distribution with parameters η ≈ 34,η ≈ 123,η ≈ 62 and η ≈ 258, respectively.
Current usage metrics show cumulative count of Article Views (full-text article views including HTML views, PDF and ePub downloads, according to the available data) and Abstracts Views on Vision4Press platform.
Data correspond to usage on the plateform after 2015. The current usage metrics is available 48-96 hours after online publication and is updated daily on week days.
Initial download of the metrics may take a while.