Fig. 4
Download original image
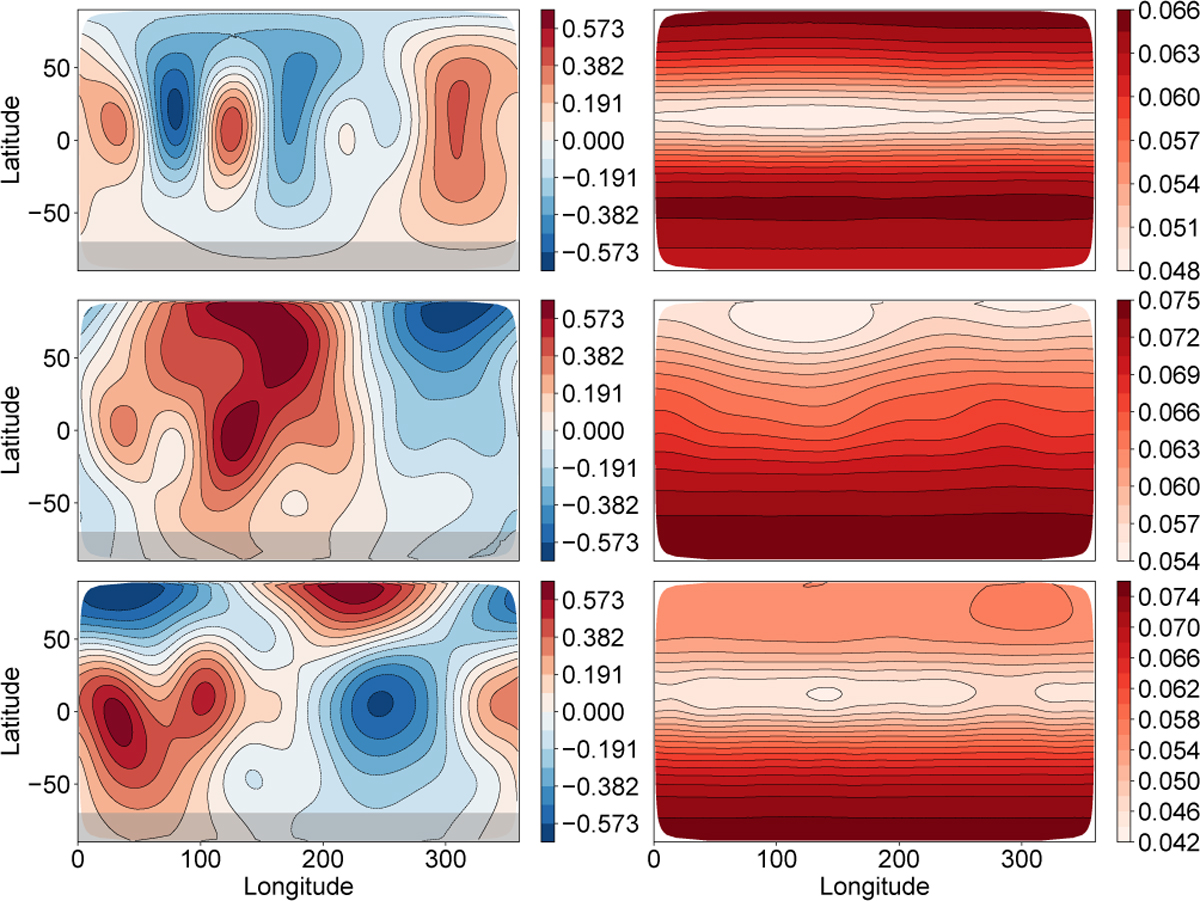
Rectangular maps of the reconstructed magnetic field and the corresponding uncertainty quantification. The left column shows the mean of the posterior magnetic field distribution across the stellar surface, in terms of the radial (top), meridional (middle) and azimuthal (bottom) magnetic field components. The field strength is given in kG. The grey transparent rectangle indicates the part of the stellar surface that is obscured from view. The right column shows the corresponding standard deviation maps. The results were obtained using a statistical model with hyperparameters Ωi,i = ηli2 and η = 100 in the marginal prior distribution for each spherical-harmonic coefficient zi. Note that the contour plots in this paper consistently use the same number of levels between the minimum and maximum values in all figures.
Current usage metrics show cumulative count of Article Views (full-text article views including HTML views, PDF and ePub downloads, according to the available data) and Abstracts Views on Vision4Press platform.
Data correspond to usage on the plateform after 2015. The current usage metrics is available 48-96 hours after online publication and is updated daily on week days.
Initial download of the metrics may take a while.