Fig. 3
Download original image
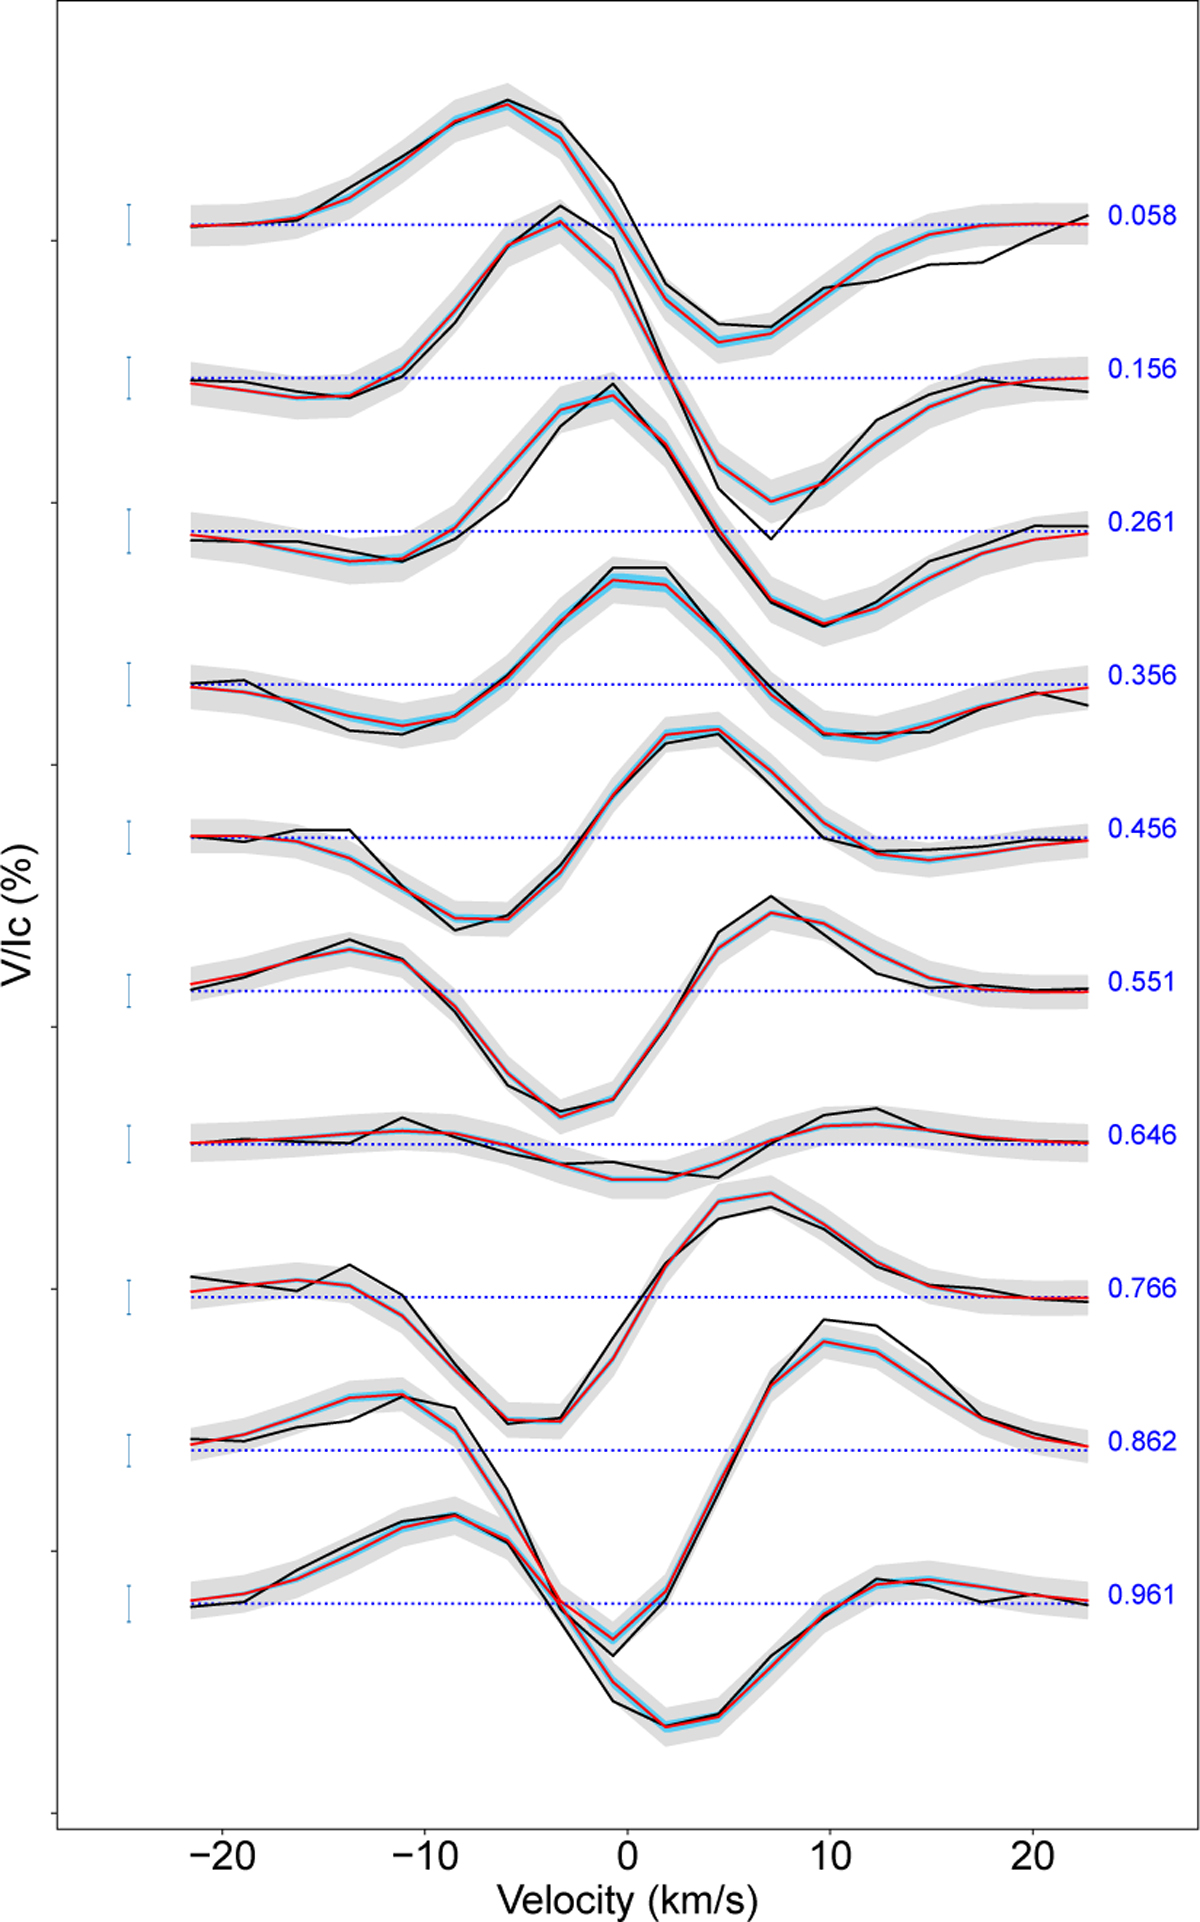
Comparison between the mean LSD Stokes V profiles (red) of the predictive distribution and the observed LSD Stokes V profiles (black), for a subset of the rotational phases. The profiles are offset vertically according to the rotational phase, as indicated in blue. The marginal predictive uncertainty is shaded in light grey and depicts three standard deviations. The corresponding posterior predictive uncertainty is shaded in light blue, and the blue bars represent the corresponding observational uncertainties.
Current usage metrics show cumulative count of Article Views (full-text article views including HTML views, PDF and ePub downloads, according to the available data) and Abstracts Views on Vision4Press platform.
Data correspond to usage on the plateform after 2015. The current usage metrics is available 48-96 hours after online publication and is updated daily on week days.
Initial download of the metrics may take a while.