Fig. C.1
Download original image
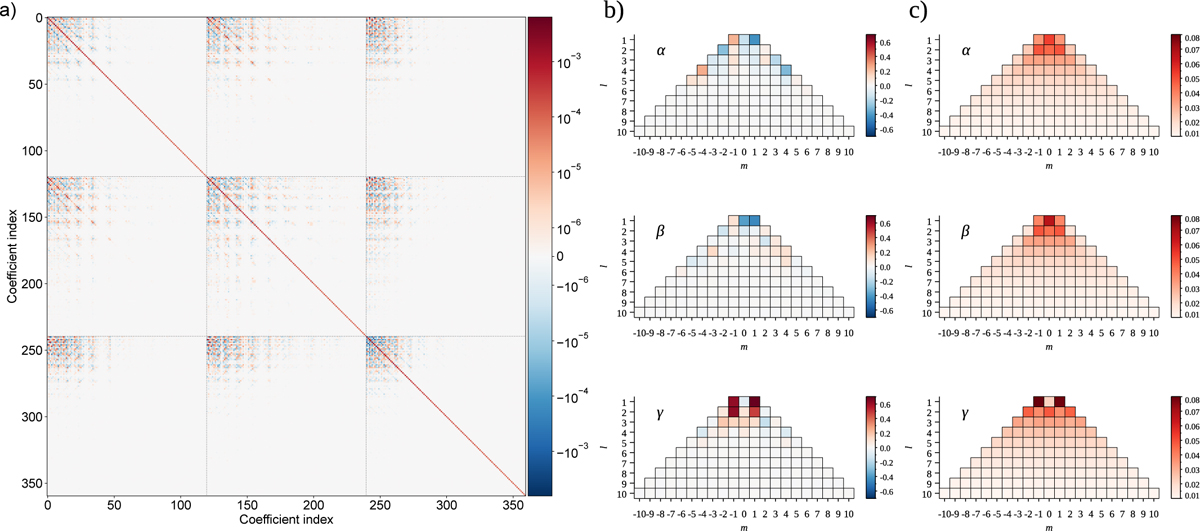
Graphical representation of the spherical harmonic coefficients and their covariances. This plot corresponds to the magnetic field reconstruction results in Fig. 4. a) Covariance matrix with the three groups of spherical harmonic coefficients, α, β, γ, stored sequentially in the order of increasing l and m numbers. Dashed lines highlight parts of the covariance matrix corresponding to each group of harmonic coefficients. b) Mean value of the spherical harmonic coefficients. c) Standard deviation of the spherical harmonic coefficients.
Current usage metrics show cumulative count of Article Views (full-text article views including HTML views, PDF and ePub downloads, according to the available data) and Abstracts Views on Vision4Press platform.
Data correspond to usage on the plateform after 2015. The current usage metrics is available 48-96 hours after online publication and is updated daily on week days.
Initial download of the metrics may take a while.