Fig. 10
Download original image
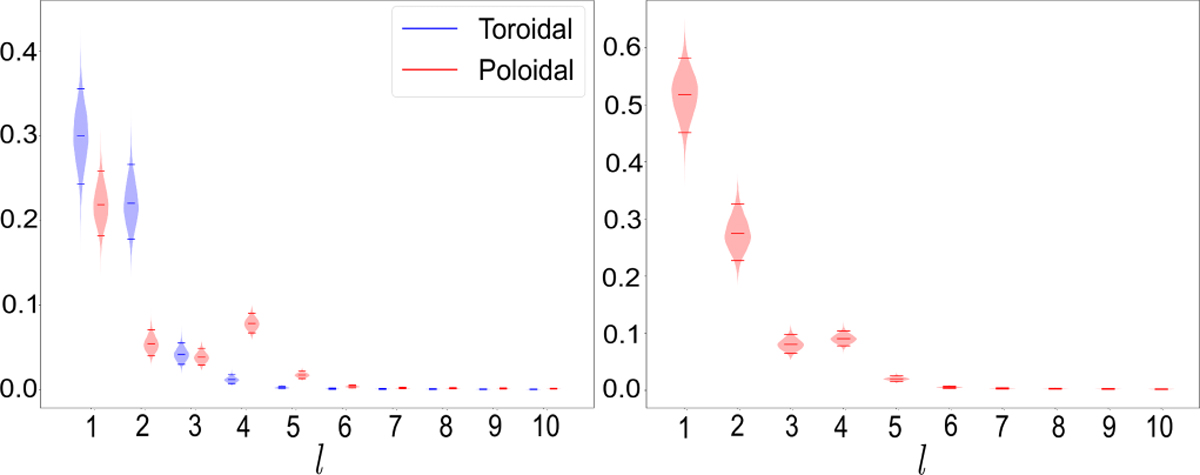
Violin plots illustrating the distribution of magnetic energy over different harmonic modes. In these plots the widths of the coloured regions represent the smoothed probability density of the fraction of the total magnetic energy, numerically obtained by sampling from the posterior distribution p(z|y) corresponding to the results illustrated in Fig. 4. Horizontal lines mark the 0.05-, 0.50- and 0.95-quantiles of the distribution at each mode, respectively. The left panel compares the energy of the toroidal contribution (blue) and the poloidal components (red) as a function of angular degree, l, with values normalised by the total energy, i.e., (Et, Ep)/Etot. The right panel shows the total magnetic energy of the poloidal and toroidal field components as a function of angular degree, l, also normalised by the total energy, i.e. (Ep +Et)/Etot.
Current usage metrics show cumulative count of Article Views (full-text article views including HTML views, PDF and ePub downloads, according to the available data) and Abstracts Views on Vision4Press platform.
Data correspond to usage on the plateform after 2015. The current usage metrics is available 48-96 hours after online publication and is updated daily on week days.
Initial download of the metrics may take a while.