Fig. 4
Download original image
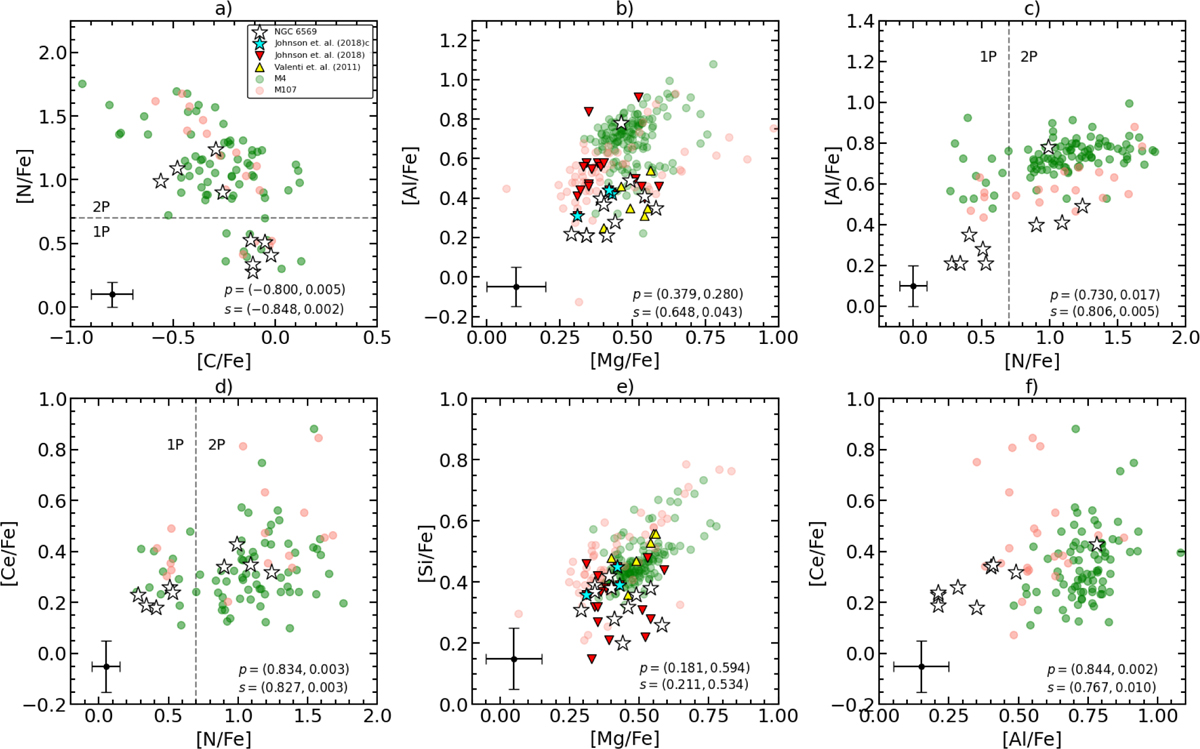
Panels (a)–(f): [C/Fe]–[N/Fe], [Mg/Fe]–[Al/Fe], [Al/Fe]–[N/Fe], [N/Fe]–[Ce/Fe], [Si/Fe]–[Mg/Fe], and [Al/Fe]–[N/Fe] distributions for NGC 6569 including this work (white stars), previous high-resolution studies (Valenti et al. (2011) (yellow triangles) and Johnson et al. (2018) (red triangles), and M4 (green circles) and M107 (orange circles) from Mészáros et al. (2020). We also show as cyan stars the three stars in common with Johnson et al. (2018). The dashed black line in panels a, c, and d represents the division between 1P and 2P at [N/Fe] = 0.7. The typical uncertainties for NGC 6569 members are also shown, as described in Section 5. Additionally, we display the Pearson and Spearman correlation coefficients along with their corresponding p values in each panel.
Current usage metrics show cumulative count of Article Views (full-text article views including HTML views, PDF and ePub downloads, according to the available data) and Abstracts Views on Vision4Press platform.
Data correspond to usage on the plateform after 2015. The current usage metrics is available 48-96 hours after online publication and is updated daily on week days.
Initial download of the metrics may take a while.