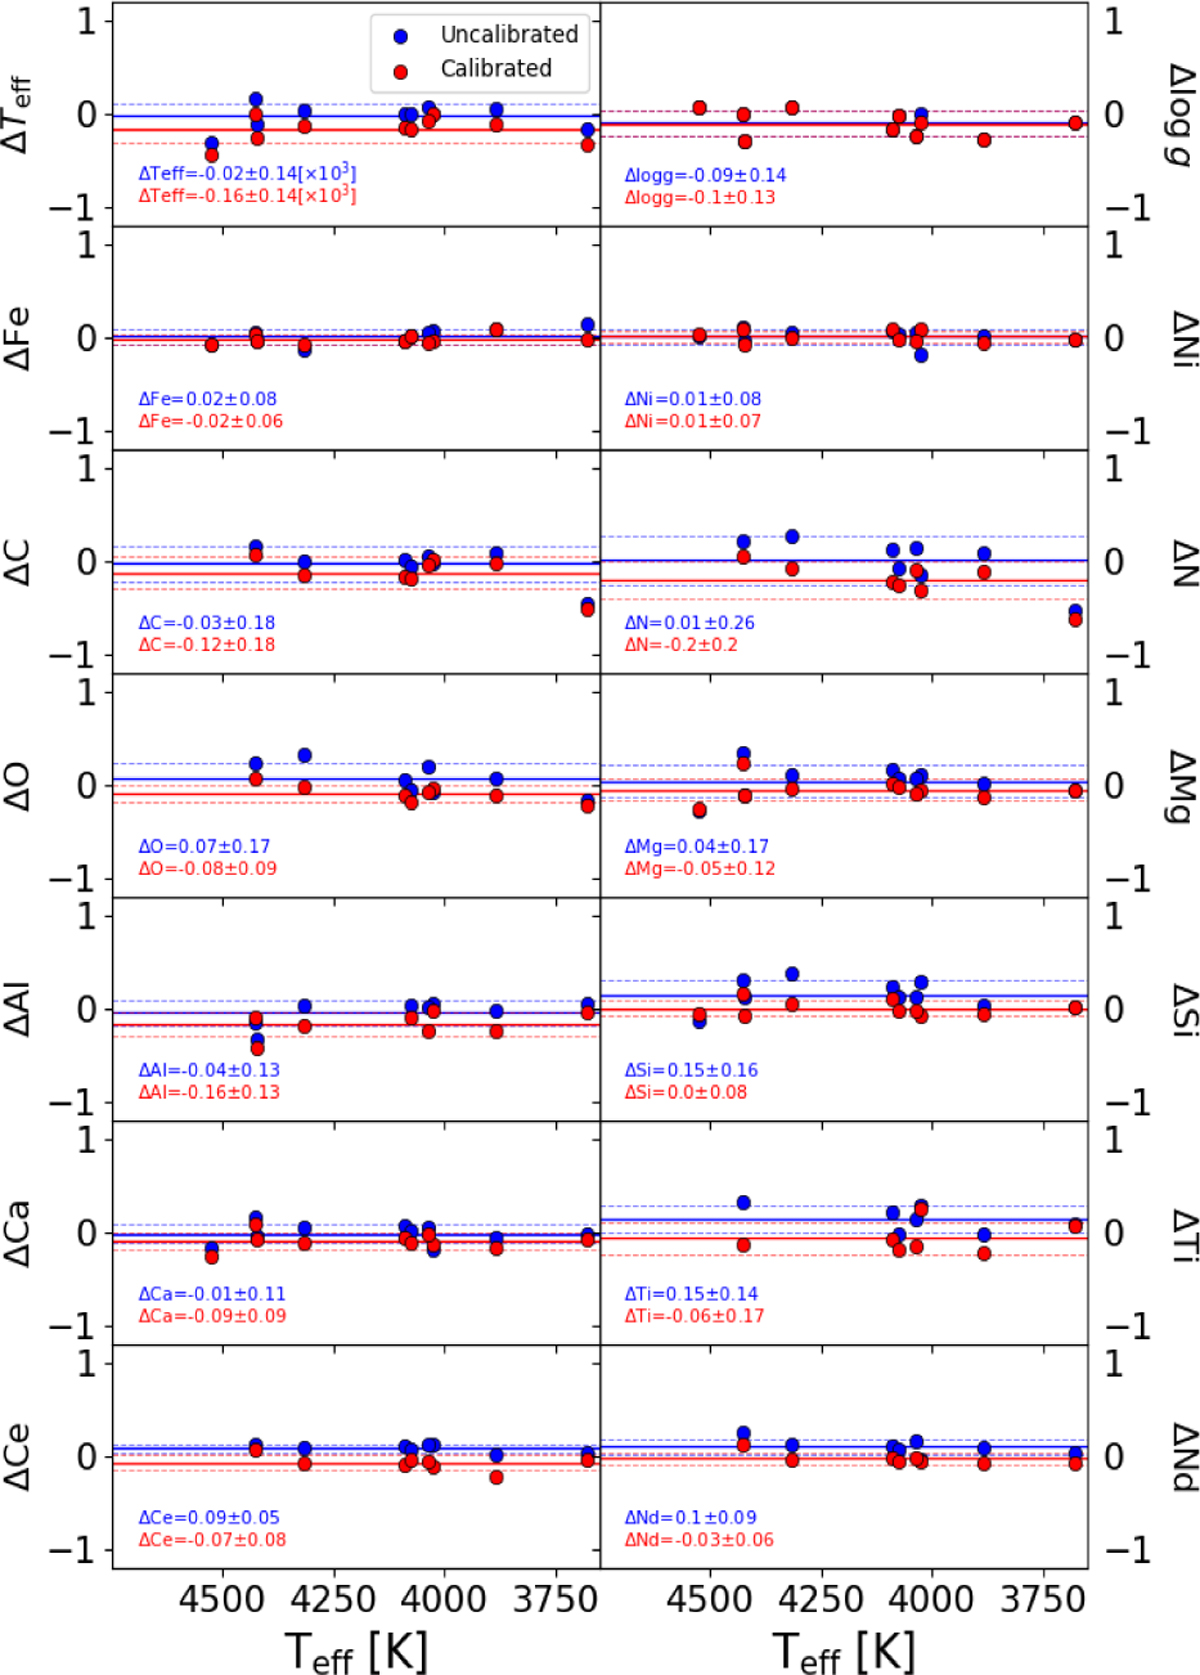
Fig. 2
Download original image
Differences in atmospheric parameters and elemental abundances are shown for three runs adopting photometric and spectroscopic parameters, as listed in Table 2. The vertical axis refers to the Δ of each atmospheric parameter and chemical species ([X/Fe]) analyzed in this work. The horizontal axis refers to the photometric Teff. The red and blue circles represent the Δ between photometric-calibrated and photometric-uncalibrated parameters, respectively. The average and standard deviation around the mean of the differences are listed in each panel.
Current usage metrics show cumulative count of Article Views (full-text article views including HTML views, PDF and ePub downloads, according to the available data) and Abstracts Views on Vision4Press platform.
Data correspond to usage on the plateform after 2015. The current usage metrics is available 48-96 hours after online publication and is updated daily on week days.
Initial download of the metrics may take a while.