Open Access
Fig. 9.
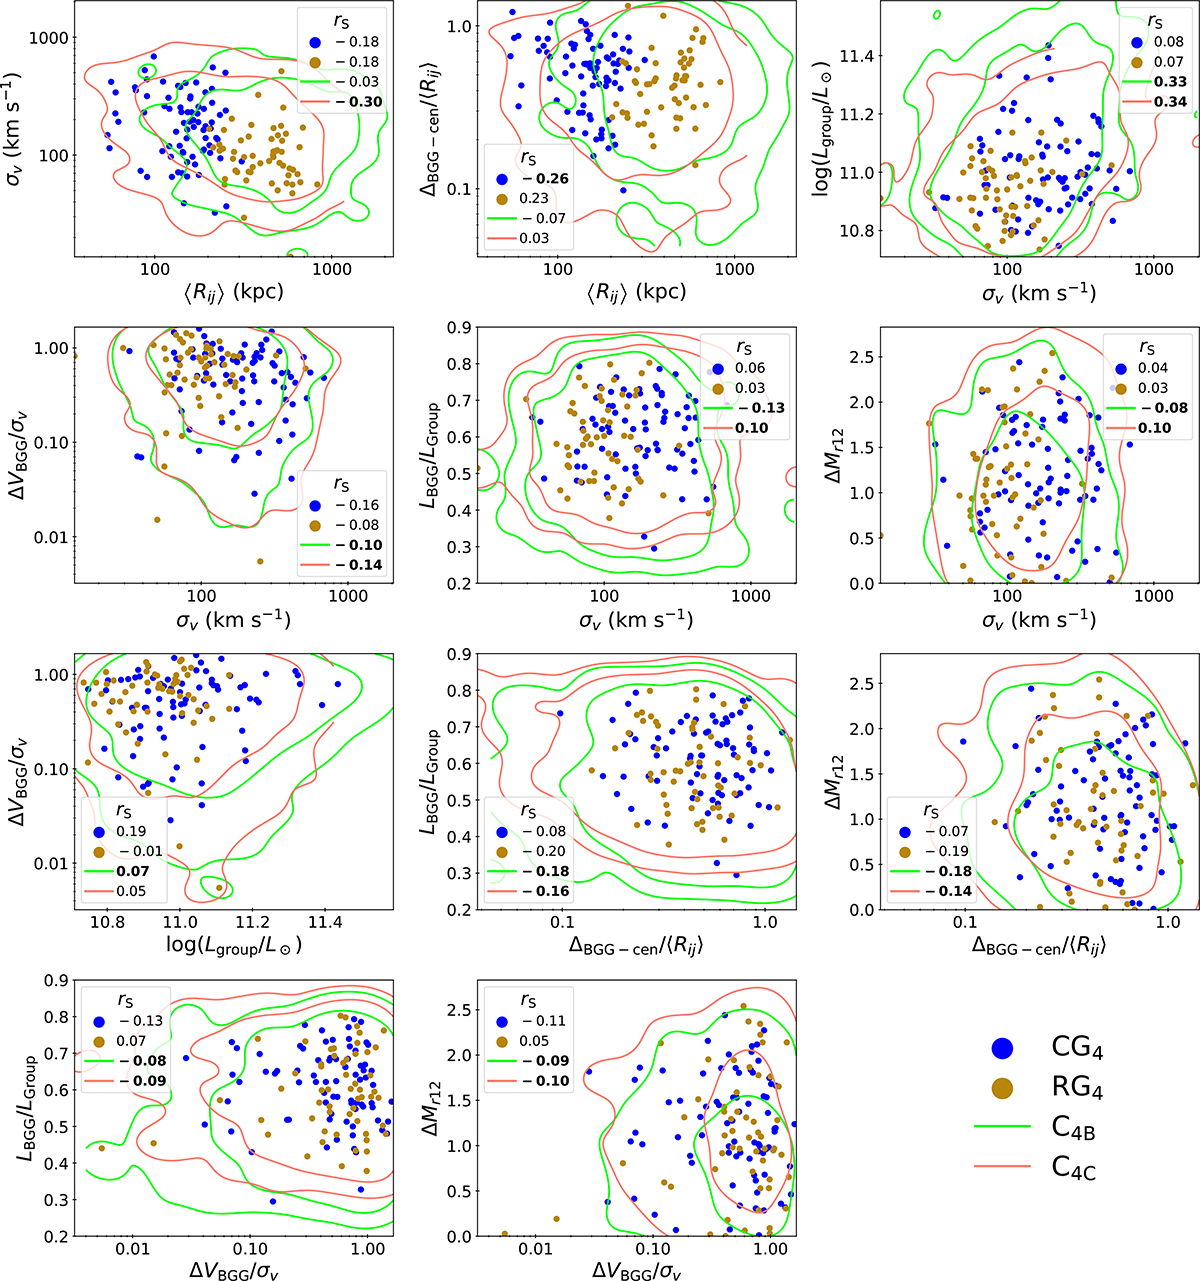
Download original image
Most significant correlations between quantities within samples as shown in Table 6. Quantities strongly correlated because of selection effects are not displayed – see main text. The legends provide the Spearman rank correlations, which are in bold if significant.
Current usage metrics show cumulative count of Article Views (full-text article views including HTML views, PDF and ePub downloads, according to the available data) and Abstracts Views on Vision4Press platform.
Data correspond to usage on the plateform after 2015. The current usage metrics is available 48-96 hours after online publication and is updated daily on week days.
Initial download of the metrics may take a while.